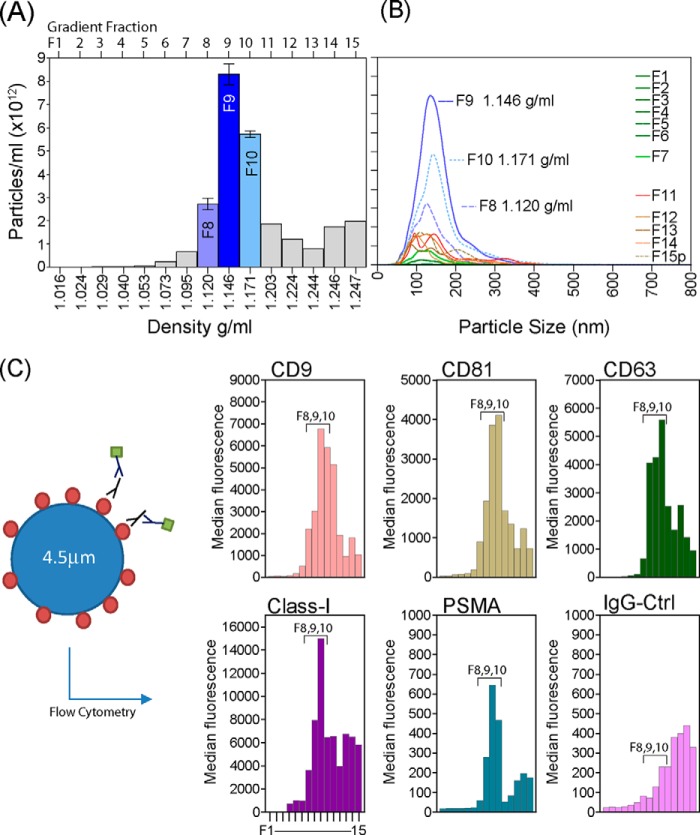
Fig. 1.
Preparation of highly pure Du145 exosomes for analysis via SOMAscanTM. Du145 exosomal vesicles were separated on a continuous sucrose gradient, and the density of 15 collected fractions was determined. Nanoparticle tracking analysis was performed on each fraction, and the particle concentration was plotted against the fraction density. Bars represent mean ± S.D. of duplicate measurements (A). The size distribution of particles within each fraction is shown, and the density of each fraction is specified, revealing single-peak, monodisperse populations of small vesicles in fractions of classical exosomal density (between 1.1 and 1.2 g/ml) (B). A proportion of each fraction was coated onto latex microbeads, stained with antibodies as specified, and analyzed via flow cytometry. Bars represent median fluorescence values from 5000 events, and the positions of fractions 8–10 are annotated (C). This characterization aided in selecting relevant fractions—specifically, F8, F9, and F10—that were pooled for subsequent array analyses.

