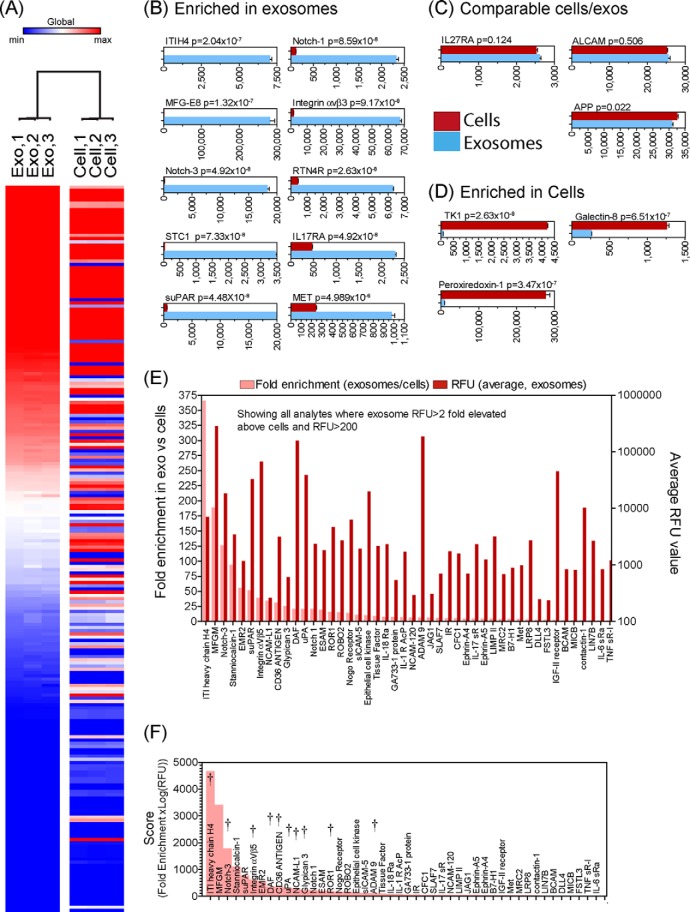
Fig. 2.
Comparison of exosomes and cells under SB17 + Nonidet P-40/DCO conditions. Exosome and cell preparations under SB17 + Nonidet P-40/DCO conditions were compared and the data were filtered to eliminate poor replicates. Data are represented as a heat map highlighting the comparison between exosomes and their parent cells (A). The data identified 57 proteins that were elevated 2-fold or greater in exosomes relative to cells, and some examples of these are shown (bars show mean RFU values ± S.E. of triplicates, and the p value is shown) (B). Eight proteins exhibited comparable expression levels (of less than 0.1-fold change) in exosomes and cells (C), whereas 89 exhibited >2-fold elevated expression in cells (D). The analytes displaying >2-fold elevation in exosomes and those with an RFU signal of >200 units are shown (E), plotted as fold enrichment (left axis) and RFU values (right axis). A simple multiplication of fold-increase × log2(RFU), used as a means of identifying proteins that may be both enriched and highly abundant in exosomes, is shown (F). Some candidate proteins were selected from this plot for subsequent validation analyses, and these are indicated with †.

