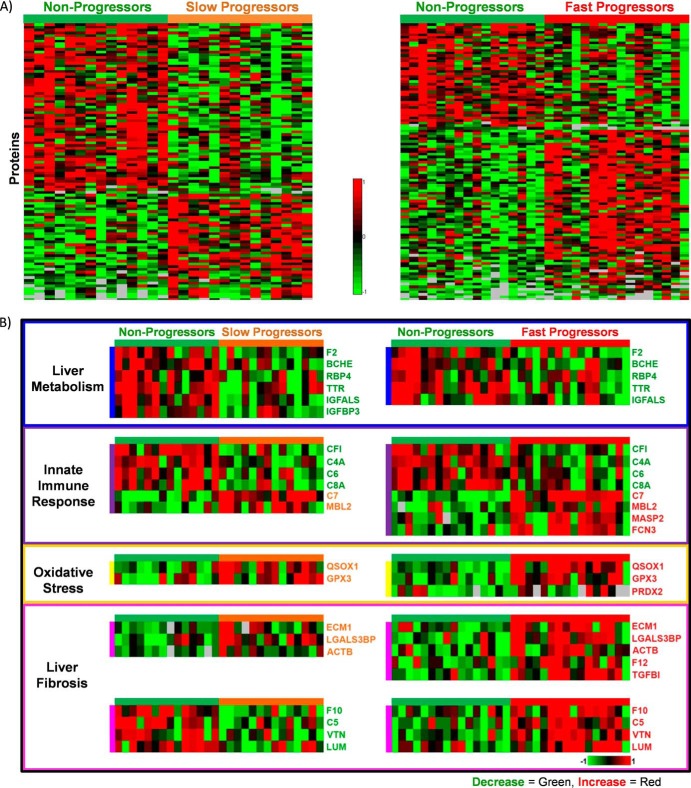
Fig. 3.
A, Heat maps representing the relative log2 intensity change for proteins with significant differential abundance when nonprogressors are compared with either slow (left) or fast progressors (right). Each column represents one of the 60 patients and each row one of the significant proteins. Trends between the patient groups are clearly observed, but biodiversity in the human population is also discerned. B, The proteins with significant differential abundance were further characterized into four groups: liver metabolism, innate immune response, oxidative stress or liver fibrosis. Twenty-six selected proteins are shown to illustrate the trend of each category where the gene names given in UniProtKB are used as abbreviated protein names. Decrease in relative abundance is shown by green and increase by red (missing values are shown as gray).

