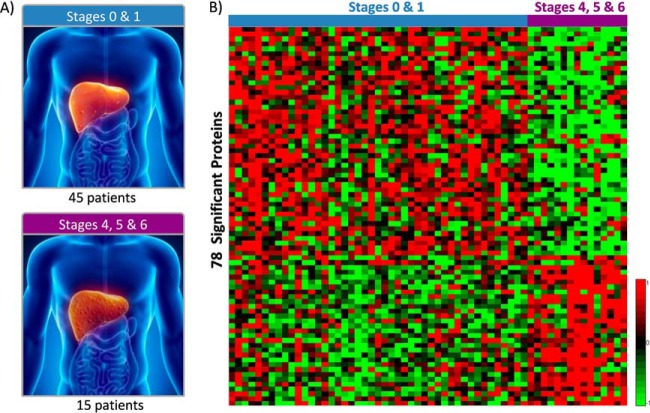
Fig. 4.
A, Blood samples from 60 HCV infected nontransplant patients were utilized for comparison and validation of the transplant patient results. Patients were categorized into two categories, low fibrosis stages 0 and 1 and high fibrosis stages 4, 5, and 6. B, Heat maps illustrating the relative log 2 intensity change for differential proteins from the nontransplant patient groups. Each column represents one of the 60 patient and each row one of the 78 significant proteins. Decrease in relative abundance is shown by green and increase by red.

