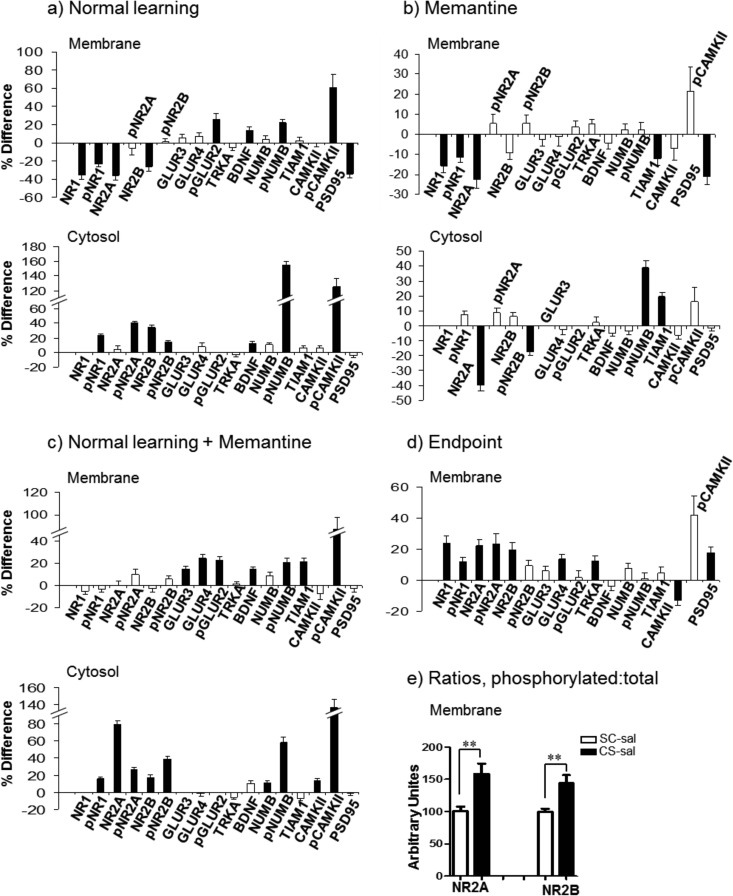
Fig. 4.
Response of the NMDA receptor subunits and related proteins in the hippocampus membrane and cytosolic fractions. A–D, legend as in Fig. 1. E, Ratios of phosphorylated to whole protein increase for NR2A and NR2B in NL; white bars, SC saline; black bars, CS saline. **, p < 0.01 by the Student's t test.

