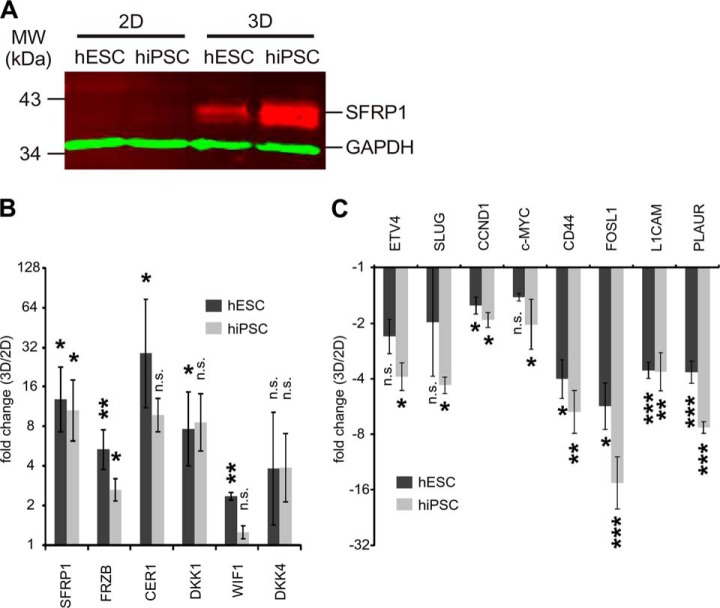
Fig. 5.
Three-dimensional culture induces up-regulation of Wnt antagonist and down-regulation of Wnt target genes. A, Western blot of SFRP1 for hESCs and hiPSCs grown under either two-dimensional or three-dimensional culture conditions. 10 μg of protein were loaded per lane. B, qPCR analysis revealing relative expression levels of Wnt antagonists in hESCs and hiPSCs, comparing expression under three-dimensional conditions to that under two-dimensional conditions for hESCs and hiPSCs individually. The mean value of two-dimensional culture for each cell line was set to 1. The y-axis has a log2 scale. p values were calculated using an unpaired two-tailed homoscedastic Student's t test. C, qPCR analysis revealing relative expression levels of Wnt target genes in hESCs and hiPSCs grown under either two-dimensional or three-dimensional culture conditions. Generation of the diagram and t test are as described for panel B.

