
Figure 3.
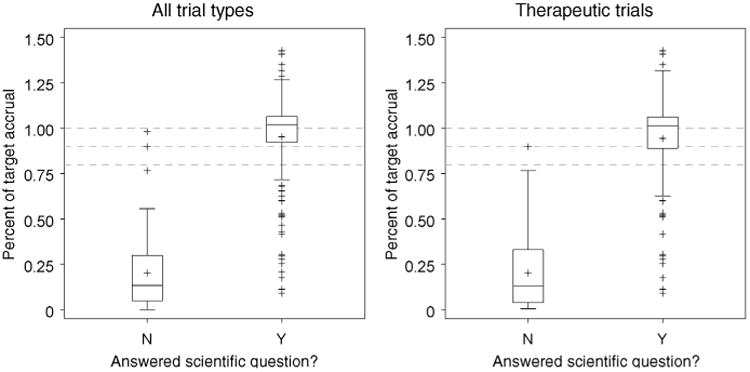
Median and interquartile range values of percentage of target accrual achieved for trials answering (Y) or not answering (N) their respective scientific question. Dashed lines represent 80%, 90%, and 100% of target accrual.
Official websites use .gov
A
.gov website belongs to an official
government organization in the United States.
Secure .gov websites use HTTPS
A lock (
) or https:// means you've safely
connected to the .gov website. Share sensitive
information only on official, secure websites.
Median and interquartile range values of percentage of target accrual achieved for trials answering (Y) or not answering (N) their respective scientific question. Dashed lines represent 80%, 90%, and 100% of target accrual.