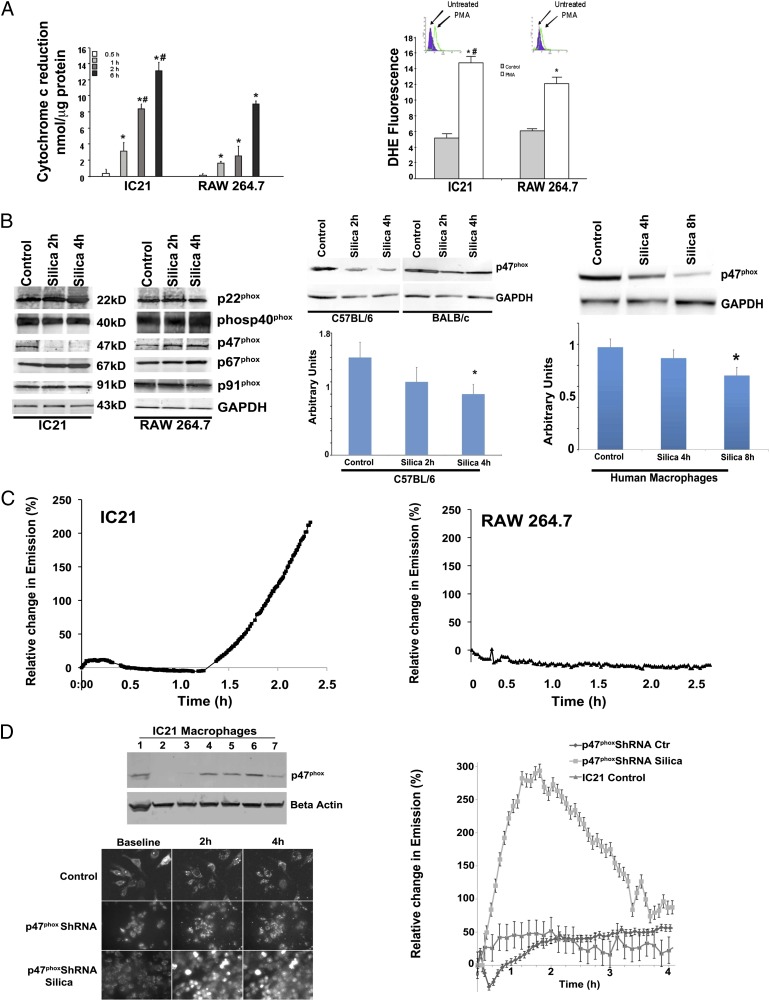
FIGURE 1.
Mitochondria are a significant source of ROS in silica-exposed IC21 macrophages. (A) Following exposure to silica (left panel) or PMA (right panel), mitochondrial superoxide anion production increased in IC21 and RAW 264.7 macrophages, but the production was significantly greater in IC21 macrophages. Superoxide anion production was measured by cytochrome c (nmol/μg protein) reduction in response to silica (20 μg/cm2) (left panel) or as changes in dihydroethidium fluorescence in response to PMA exposure (right panel). Basal level of cytochrome c reduction in untreated cells (5.3 nmol/μg protein in IC21 macrophages; 3.8 nmol/μg protein in RAW 264.7 macrophages) was subtracted from values obtained from silica-stimulated cells. Data are representative of duplicate samples obtained on three occasions. *p < 0.001 versus control, #p < 0.001 versus RAW 264.7 cell line at same time point. (B) In response to silica, p47phox protein decreased in IC21, but not in RAW 264.7, macrophages. Western blot analysis of NADPH oxidase proteins in IC21 and RAW 264.7 macrophages revealed reduced p47phox expression in IC21 macrophages in response to silica (20 μg/cm2) (left panel). Macrophages isolated from the bone marrow of C57BL/6 mice, but not from BALB/C mice (middle panel), as well as monocyte-derived human macrophages (right panel), reacted to silica with significant reductions in p47phox expression. *p < 0.05 versus control. (C) Following exposure to silica, mitochondrial superoxide anion production increased in both macrophage cell lines, but the production was greater in IC21 macrophages. Graphs illustrate the time course of MitoSOX emission by IC21 and RAW 264.7 cells (n = 5 tests/cell line, with 10 stage positions/test and six cells/stage position). (D) IC21 macrophages were infected with p47phox-specific shRNA lentiviral particles also coding for puromycin resistance. Reduced p47phox expression was confirmed by Western blot (upper left panel), and shRNA p47phox IC21 cells (lane 2) were selected and expanded, under puromycin, for further experimentation. Photomicrographs (lower left panel, using original magnification ×10) and graph (right panel) illustrate the time-course of MitoSOX emission by IC21 and shRNA p47phox IC21 macrophages, alone or in response to silica (20 μg/cm2) Data are representative of five different experiments with each experiment monitoring 10 stage positions that included six cells per stage position.

