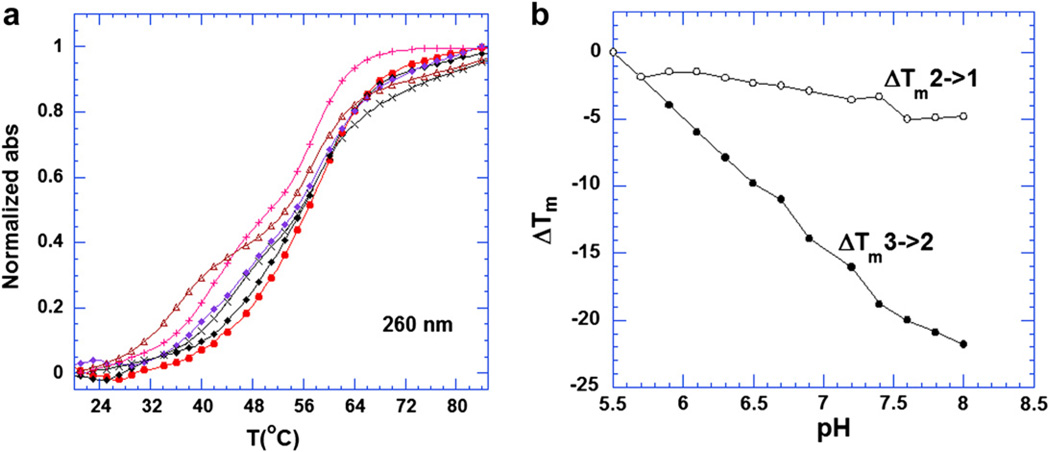
Fig. 3.
(a) UV melting profiles at 260 nm of the 5′-dA12-x-dT12-x-dT12-3′ triplex in the presence of 8 µM neomycin (rdb = 0.75). From left to right, the pH values of solutions were 7.4, 6.9, 6.7, 6.3, 5.9 and 5.5, respectively. (b) Plots of the ΔTm3→2 and ΔTm2→1 of the 5′-dA12-x-dT12-x-dT12-3′ triplex as a function of increasing pH value in the presence of 8 µM neomycin (rdb = 0.75). The Tm for the triplex was determined from the profiles at 280 nm ΔTm = Tm(any pH)-Tm(5.5). All the buffer solutions contained 10 mM sodium cacodylate, 0.5 mM EDTA and 100 mM KCl. DNA triplex concentration was 1 µM in strand.

