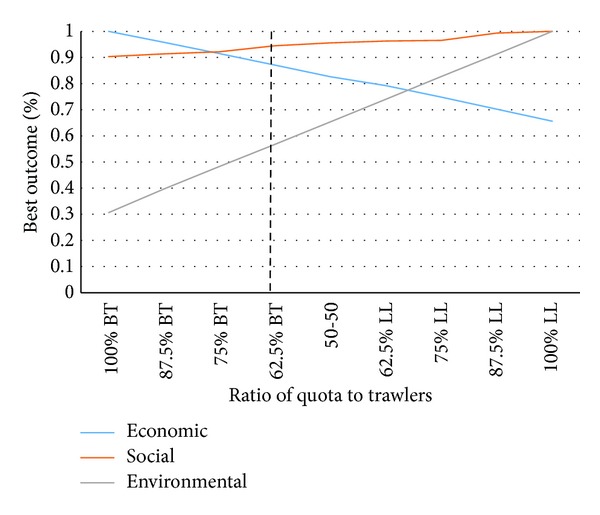
Figure 7.

Main results from running simulations with different quota allocations. To the far left we display the case where the entire quota under consideration is allocated to bottom trawlers and the far right shows the opposite case with the entire quota allocated to longliners.
