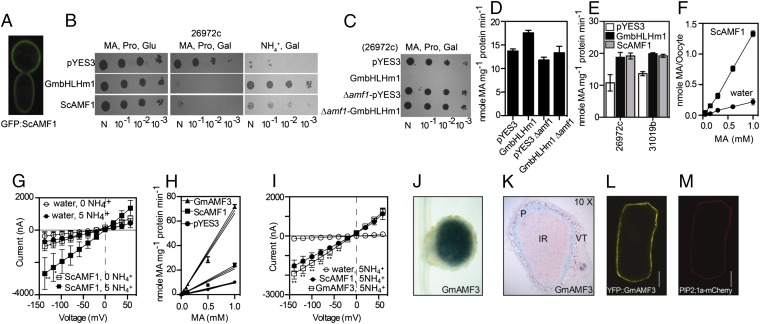
Fig. 3.
NH4+ transport through interactions between GmbHLHm1 and the membrane transporter AMF1. (A) Confocal image of N-terminal GFP:ScAMF1 localized to the PM in yeast. (B) 26972c cell growth (GmbHLHm1, ScAMF1, or pYES3) on minimal media containing 2% (wt/vol) galactose or glucose and either 0.1% l-proline (Pro), 0.1% l-proline plus 0.1 M MA (MA), or 1 mM NH4+ (NH4+). (C) Cell growth (26972c or 26972c:∆amf1) with GmbHLHm1 or pYES3 on minimal media containing 2% (wt/vol) galactose and 0.1% l-proline plus 0.1 M MA (MA). (D) Uptake of 1 mM [14C]MA by 26972c or 26972c:∆amf1 yeast cells (n = 6). (E) Uptake of 1 mM [14C]MA by 26972c or 31019b cells containing GmbHLHm1 or ScAMF1 (n = 6). (F) Concentration dependence of MA uptake into X. laevis oocytes injected with ScAMF1 cRNA or water (control) (n = 10). (G) Current–voltage curves of X. laevis oocytes injected with cRNA-ScAMF1 (squares) or water (circles). Injected oocytes were measured in 200 mM mannitol, 1 mM MgCl2, 0.2 mM CaCl2, 10 mM Hepes, and pH 7.5 adjusted with Tris base with or without NH4Cl as indicated (n = 3). (H) Uptake of [14C]MA by 26972c cells containing pYES3, ScAMF1, or GmAMF3 (Glyma08g06880) (n = 6). Data points are means ± SE. (I) Current–voltage curves of X. laevis oocytes injected with cRNA-ScAMF1 (solid circles), cRNA-GmAMF3 (squares), or water (open circles). *P < 0.05; **P < 0.001 (Tukey’s test). In H, data points have a nonlinear fit curve fit, and the 95% confidence intervals are presented. (J and K) Light images of a GmAMF3 promoter–GUS fusion in A. rhizogenes (K599)-mediated hairy roots inoculated with Bradyrhizobium japonicum USDA 110. (L and M) Confocal images of YFP-GmAMF3 (L) and AtPIP2;1a-mCherry (M) in bombarded onion epidermal cells viewed under a epifluorescence microscope. (Scale bar, 40 µm.)

