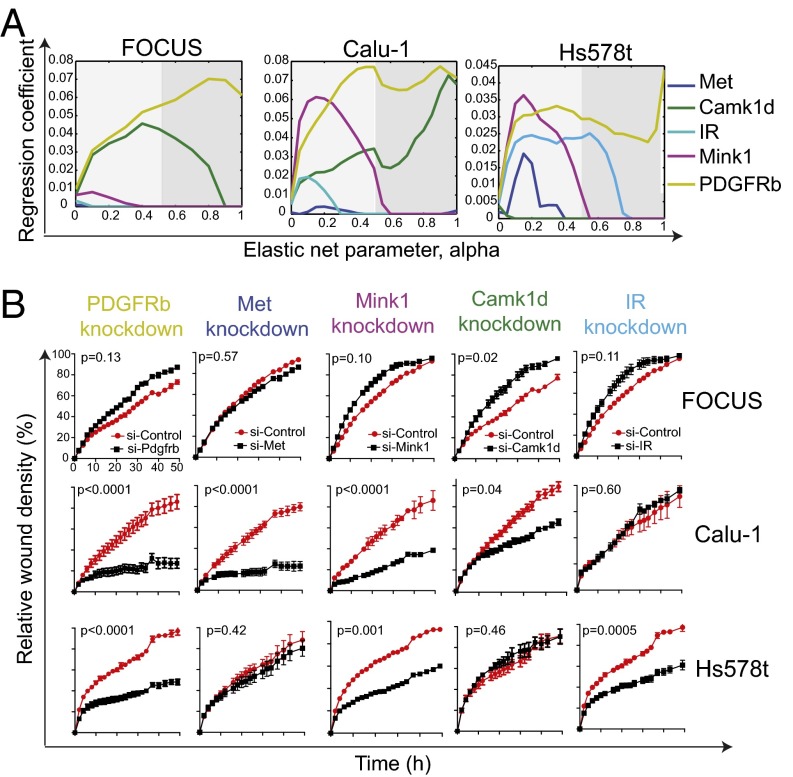
Fig. 4.
Validation of cell type-specific kinases that are determinant of mesenchymal cell migration. (A) Evolution of regression coefficients. Plots showing regression coefficients for respective kinases against value of elastic-net penalty α. Nonzero regression coefficients for kinases picked at α > 0.5 (gray region) are considered significantly informative. (B) RNAi-mediated knockdown of cell type-specific kinases in mesenchymal cancer cells. Plots showing relative wound density of indicated mesenchymal cell lines transfected with either a siRNA targeting the indicated kinase or against a scrambled control. Data are the mean of at least three independent samples and error bars indicate SEM.

