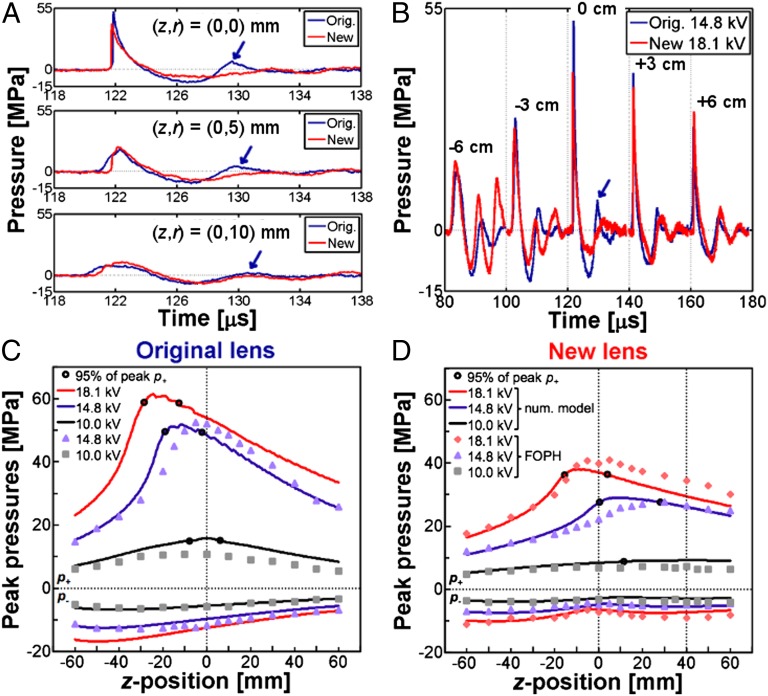
Fig. 2.
Lens characterization. Averaged pressure waveforms at (A) three radial positions (r = 0, 5, and 10 mm) in the geometric focal plane of the original lens or lithotripter focal plane (z = 0 mm) and (B) positions along the central lithotripter (z) axis. Arrows indicate secondary compression in the original lens waveform at z = 0 mm; p+ and p− along the z axis at three different source voltages using the (C) original lens and (D) new lens. Continuous lines represent numerical model predictions of peak pressures and filled shapes indicate FOPH measurements; unfilled dark circles mark minimum uncertainty range for location of p+ as predicted by numerical model. Vertical dotted lines indicate the geometric foci of the original (z = 0 mm) and new (z = +40 mm) lenses. For both lenses, z = 0 mm on the central axis coincides with the lithotripter focus where kidney stones are aligned during SWL.

