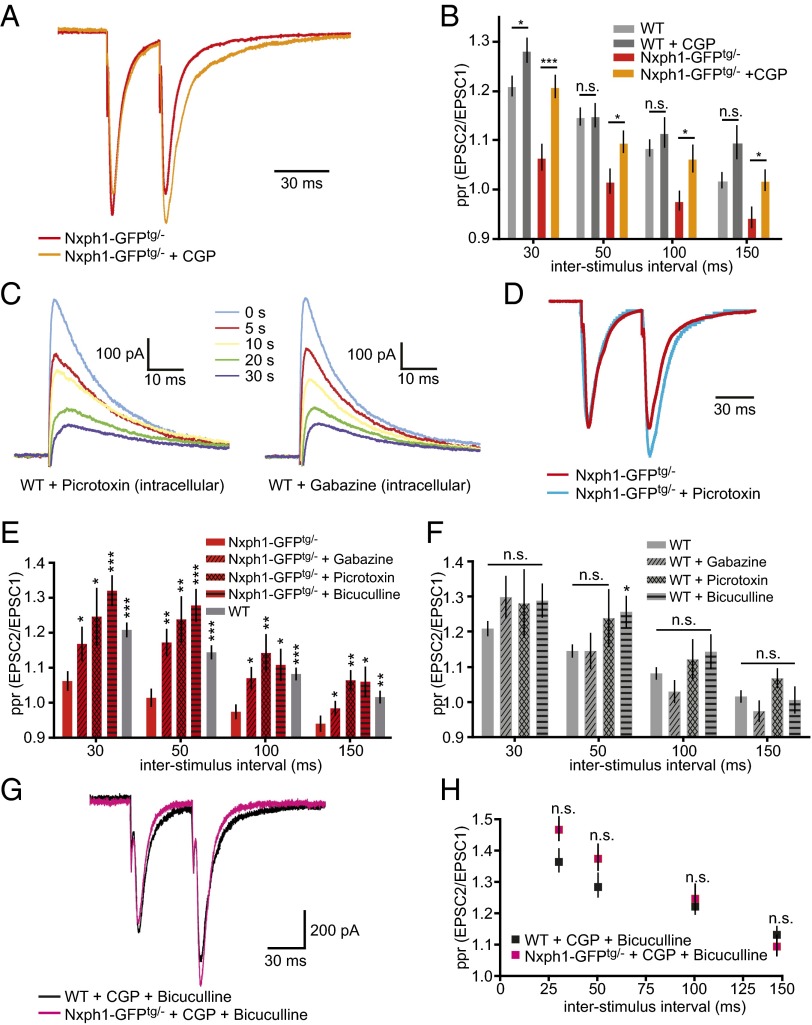
Fig. 7.
The effect of Nxph1 on short-term plasticity depends on functional GABAA and GABAB receptors. (A) Normalized amplitude traces of paired-pulse experiments from Nxph1-GFPtg/− neurons (red) change after CGP treatment toward facilitation (orange). (B) Analysis of different interstimulus intervals demonstrates that reduced ppr in Nxph1-GFPtg/− is partially rescued by the GABABR inhibitor (orange), whereas facilitation in WT neurons (light gray) remains almost unchanged (dark gray). (C) Averaged current traces of eIPSCs activated by single electrical pulses at 0.20 mA from WT neurons and recorded at indicated times after obtaining the whole-cell configuration. Patch pipettes were tip-filled with internal solution free of blockers and backfilled with solution containing either pictrotoxin or gabazin. Recorded eIPSCs decreased in amplitude in a time-dependent manner, indicating gradual diffusion of gabazine or picrotoxin into the cell (time of first amplitude reduction defined as 0 s; for picrotoxin, n = 7 cells/four mice; for gabazine, n = 8 cells/three mice). (D) Normalized amplitude traces of paired-pulse experiments from Nxph1-GFPtg/- neurons without (red) and with intracellular application of picrotoxin (blue). (E) Treatment of Nxph1-GFPtg/− (red) with GABAAR inhibitors bicuculline (bath application), picrotoxin, or gabazine (intracellular application) restores ppr to WT levels (gray). (F) Treatment of WT with bicuculline, picrotoxin, or gabazine has almost no effect on ppr. (G) Current traces of ppr experiments during combined treatment with CGP and bicuculline to block GABAB and GABAA receptors (WT, black; Nxph1-GFPtg/− magenta). (H) Facilitation during simultaneous application at different interstimulus intervals shows that normal ppr levels are restored in Nxph1-GFPtg/−. Data are means ± SEM (collected from 7 to 25 neurons from seven to eight mice per condition/genotype). Significance of differences was tested for several combinations of datasets as shown by horizontal lines in B (in E and F, comparisons are against the values of the first bar) using Student t test for unpaired values. Levels are indicated as *P < 0.05, **P < 0.01, and ***P < 0.001. n.s., not significant.

