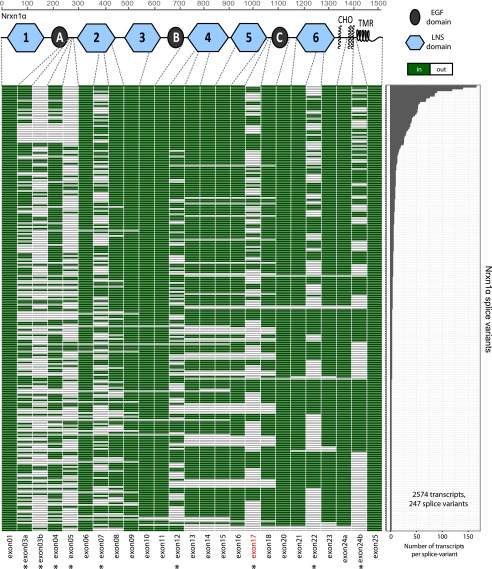
Fig. 2.
Splice landscape of Nrxn1α. The transcript map visualizes the 247 unique alternatively spliced isoforms (rows) observed for the 2,574 full-length Nrxn1α mRNAs sequenced. Exons (columns) are colored in green if present and in white if absent, and are numbered at the bottom (asterisks, exons with canonical alternative splicing; for an explanation of the numbering, see Fig. S1). The domain structure of Nrxn1α is shown at the top (light blue hexagons, LNS domains; black ovals, EGF-like domains; CHO, O-linked sugar modifications; TMR, transmembrane region) and is connected to the exons that encode the respective domains by dotted gray lines. The abundance of each splice isoform is shown in the bar graph (Right).

