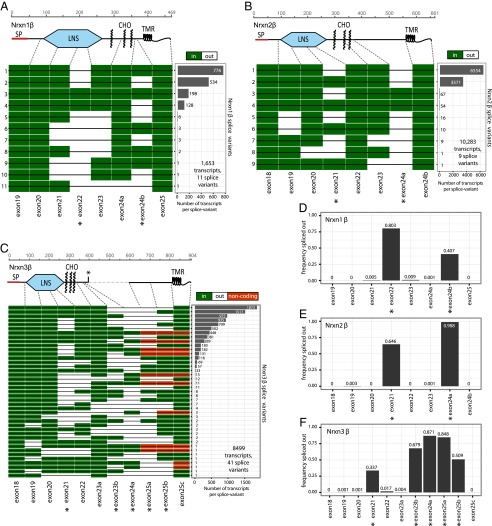
Fig. 5.
Splice landscape of β-neurexins. (A–C) Transcript maps visualizing unique splice isoforms (rows) observed for Nrxn1β (A; 1,653 transcripts, 11 splice variants), Nrxn2β (B; 10,283 transcripts, 9 splice variants), and Nrxn3β (C; 8,499 transcripts, 41 splice variants). Exons (columns) are colored in green if present and in white if absent, and are numbered at the bottom (asterisks, exons with canonical alternative splicing; for an explanation of the numbering, see Fig. S1). The domain structures of the respective β-neurexins are shown above the transcript maps and are connected to the exons that encode the respective domains by dotted gray lines. SP denotes the signal peptide; the asterisk in the domain structure of Nrxn3β indicates a stop codon encoded by one of the alternatively spliced exons. The abundance of each splice isoform is shown in the bar graph (Right). (D–F) Bar graphs visualizing the relative frequency of exon skipping for the indicated exons in the Nrxn1β (D), Nrxn2β (E), and Nrxn3β mRNAs (F). Canonical alternatively spliced exons are marked by asterisks.

