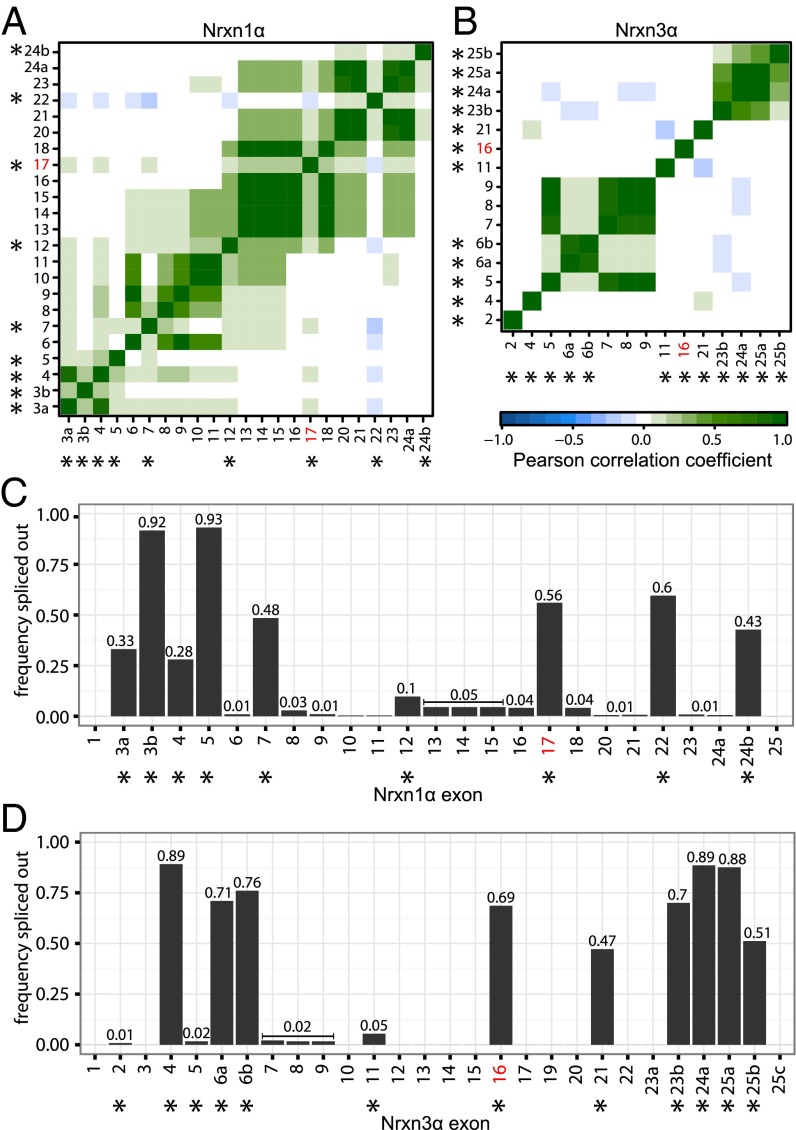
Fig. 6.
Independent and coordinated splicing of canonical and novel splice sites for Nrxn1α and Nrxn3α. (A and B) Correlograms showing the pairwise correlation in splice behavior between alternatively spliced exons of (A) Nrxn1α and (B) Nrxn3α. The color bar denotes the Pearson correlation coefficient from −1 (blue, anticorrelated splicing) through 0 (no correlation in splicing) to 1 (green, positively correlated splicing). Newly observed alternatively spliced exons tend to be spliced out in a coordinated way, whereas canonical events of alternative splicing appear to occur independent of each other. (C and D) Bar graphs visualizing the frequency of each exon to be spliced out for (C) Nrxn1α and (D) Nrxn3α. Canonical alternatively spliced exons (12) are marked by asterisks. Exons that are observed to be alternatively spliced in a coordinated way (A and B) show similar frequencies.

