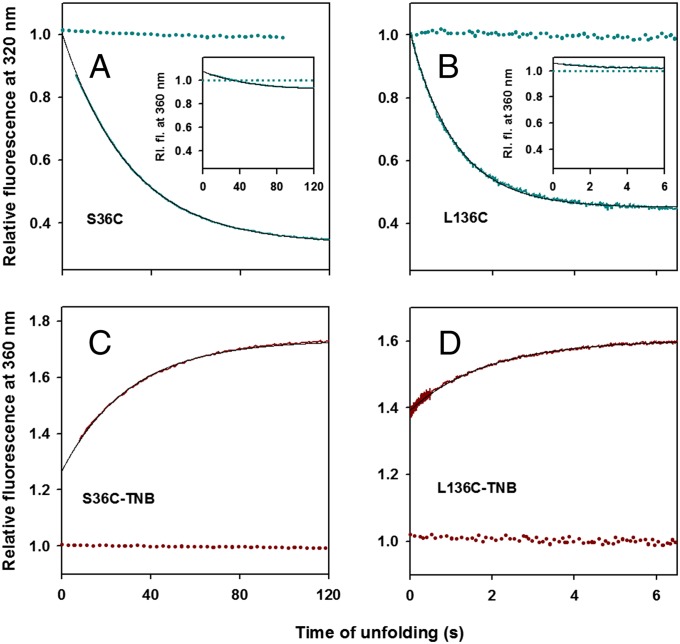
Fig. 2.
Unfolding kinetics of unlabeled and TNB-labeled proteins monitored by change in Trp fluorescence in 3.2 M GdmCl. (A) S36C; (B) L136C; (C) S36C-TNB; and (D) L136C-TNB. In A and B, the solid cyan line represents the change in fluorescence intensity of unlabeled proteins at 320 nm during unfolding. The data are normalized to the value of 1 for the signal of unlabeled native protein at 320 nm (dashed cyan line). A and B (Insets) show the change in fluorescence intensity of unlabeled proteins at 360 nm (solid cyan line) during unfolding, which is normalized to the value of 1 for the signal of unlabeled native protein at 360 nm (dashed cyan line). C and D show the change in fluorescence intensity of TNB-labeled proteins at 360 nm (solid dark red line) during unfolding. The data in C and D are normalized to the value of 1 for the signal of TNB-labeled native protein at 360 nm (dashed dark red line). In A−D, the black solid line is a single exponential fit to the observed data.

