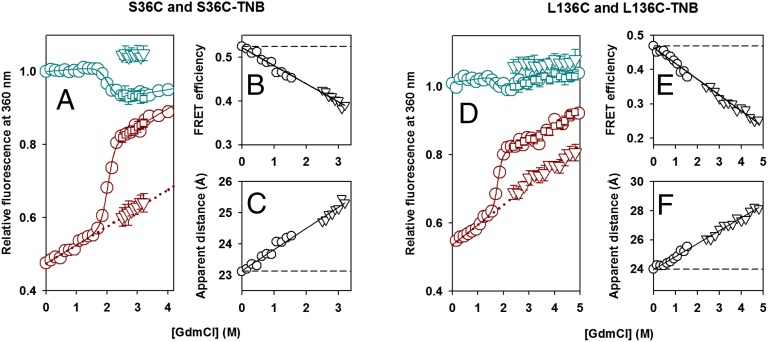
Fig. 3.
Dependence of the amplitude of the initial fast phase of unfolding on the concentration of GdmCl. Kinetic versus equilibrium amplitudes of the unfolding of unlabeled and TNB-labeled proteins as monitored by the change in fluorescence at 360 nm. (A) S36C and S36C-TNB; (D) L136C and L136C-TNB. In A and D, the cyan circles represent the equilibrium unfolding transition of the unlabeled protein. The solid cyan line through the data represents a fit to a two-state native (N) ⇌ unfolded (U) model. The cyan inverted triangles and the cyan squares represent the t = 0 and t = ∞ signals, respectively, obtained from fitting the kinetic traces of unfolding of the unlabeled protein to a single exponential equation. The dark red circles represent the equilibrium unfolding transition of the TNB-labeled protein, the continuous dark red line represents a fit to a two-state N ⇌ U model, and the dotted dark red line is a linear extrapolation of the native protein baseline. The dark red squares represent the t = ∞ signal, and the dark red inverted triangles represent the t = 0 signal, obtained from fitting the kinetic traces of unfolding of the TNB-labeled protein to a single exponential equation. The error bars, where shown, represent SDs of the measurements from at least three separate experiments. In B and E, the FRET efficiencies in the forms of each protein, which are populated before commencement of the observable unfolding phase, are plotted (inverted triangles) against the concentration of GdmCl for S36C-TNB and L136C-TNB, respectively. Also shown (circles) are the FRET efficiencies in the native forms of each protein, which are populated in the GdmCl concentrations that define the native protein baseline of the equilibrium unfolding transition. The data in B and E were converted into apparent change in distances by using Eq. 1, and the distances are shown in C and F for S36C-TNB and L136C-TNB, respectively.

