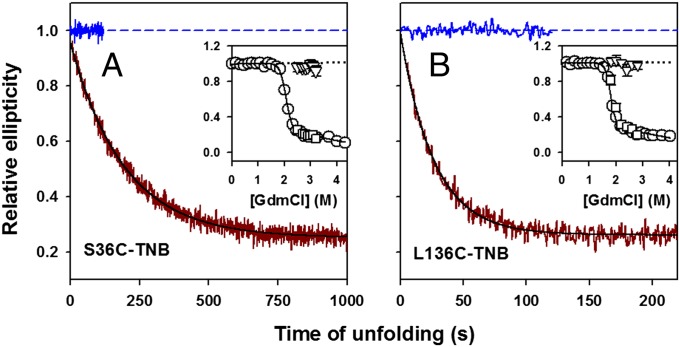
Fig. 4.
Kinetics of change in secondary structure during unfolding as monitored by change in far-UV CD signal at 222 nm. (A) S136C-TNB; (B) L136C-TNB. In A and B, the solid dark red line shows the kinetic trace of unfolding in 2.5 M GdmCl, and the solid black line through the data is a fit to a single exponential equation. The data are normalized to the value of 1 for the signal of native protein (solid and dashed blue lines). Insets compare the kinetic versus equilibrium amplitudes of unfolding. The circles represent the equilibrium unfolding transition, and the continuous line through the data represents a fit to a two-state N ⇌ U model. The triangles represent the t = 0 signal, and the squares represent the t = ∞ signal, obtained from fitting the kinetic traces of unfolding to a single exponential equation. The black dotted line is a linear extrapolation of the native protein baseline. The error bars, wherever shown, represent the SDs of measurements from three separate experiments.

