Fig. 5.
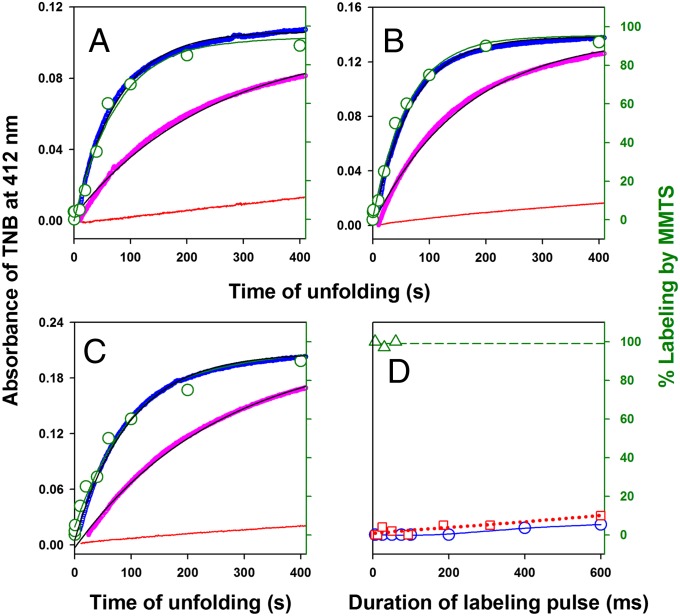
Kinetics of core solvation during unfolding by monitoring the reactivity of buried thiols against labeling by DTNB and MMTS. Three single-cysteine-containing variants of RNase H, (A) I7C (Cys7), (B) A24C (Cys24), and (C) I53C (Cys53), were generated, and each of them was diluted in solutions containing 1.3 mM DTNB and 0 M (red), 3 M (magenta), and 3.4 M (blue) GdmCl (A−C). The unfolding reaction was monitored by the change in absorbance at 412 nm due to the release of TNB molecules and is shown according to the left y axis. The solid black line through the data is fit to a single exponential equation. The kinetics of change in cysteine accessibility during unfolding as monitored by MMTS labeling is shown in green according to the right y axis. Fractional labeling (green circle) is plotted against the time of application of the labeling pulse (6-ms pulse of 20 mM MMTS) after the commencement of unfolding in 3.4 M GdmCl. The green solid line is a fit of the MMTS labeling data to a single exponential equation. D shows the accessibility (protection factor) of Cys53 to MMTS labeling in the unfolded protein (3.4 M GdmCl) (green triangle and green dashed line), the native protein (0 M GdmCl) (blue circle and blue solid line), and the initially expanded globule (red squares and red dashed line). The lines through the data are drawn only to help visual inspection. The extent of labeling is plotted against the duration of the labeling pulse containing 20 mM MMTS. For the initially expanded globule, labeling pulse was applied 500 ms after the initiation of the unfolding reaction in 3.4 M GdmCl.

