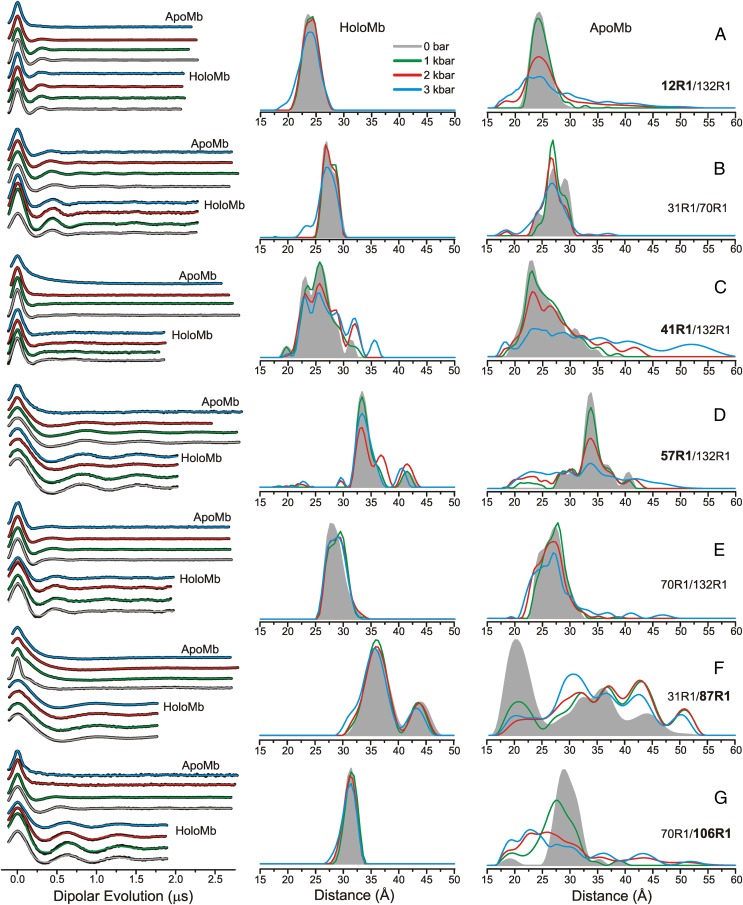
Fig. 3.
Variable-pressure DEER distance distributions for holoMb and apoMb at pH 6. (Left) Background-corrected dipolar evolutions are shown in black, with fits to the data (Methods) overlaid and color-coded by pressure. (Center and Right) The area-normalized distance distributions are shown for holoMb (Center) and apoMb (Right) for (A) 12R1/132R1, (B) 31R1/70R1, (C) 41R1/132R1, (D) 57R1/132R1, (E) 70R1/132R1, (F) 31R1/87R1, and (G) 70R1/106R1. The Inset indicates the color coding of the distance distributions and fits to the dipolar evolutions. Dipolar evolutions are vertically offset for clarity. Bold labels indicate sites in each mutant in which structural motion as a function of pressure is attributed.

