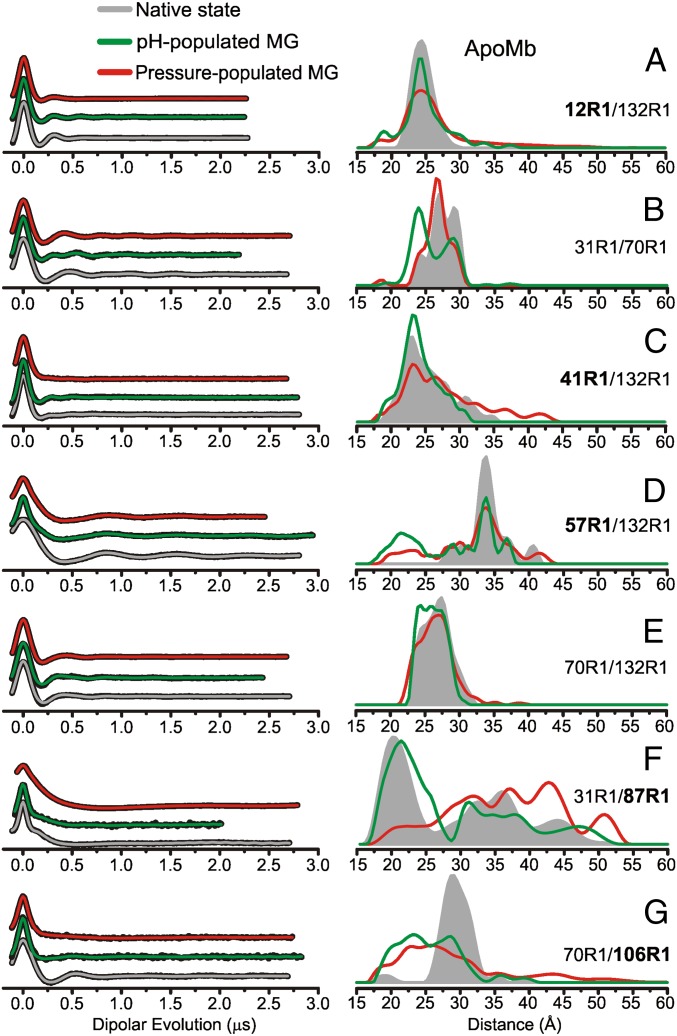
Fig. 4.
DEER distance distributions for the conformational ensemble of apoMb in the native state at 0 bar and pH 6, the pH-populated MG at 0 bar and pH 4.1, and the pressure-populated MG at 2 kbar and pH 6. (Left) Background-corrected dipolar evolutions of the indicated mutants are shown in black with fits to the data (Methods) overlaid and color coded by state. (Right) The area-normalized distance distributions from are shown for (A) 12R1/132R1, (B) 31R1/70R1, (C) 41R1/132R1, (D) 57R1/132R1, (E) 70R1/132R1, (F) 31R1/87R1, and (G) 70R1/106R1. The Inset indicates the color coding of the distance distributions and fits to the dipolar evolutions. Dipolar evolutions are vertically offset for clarity. Bold labels indicate sites in each mutant in which structural motion as a function of pressure is attributed.

