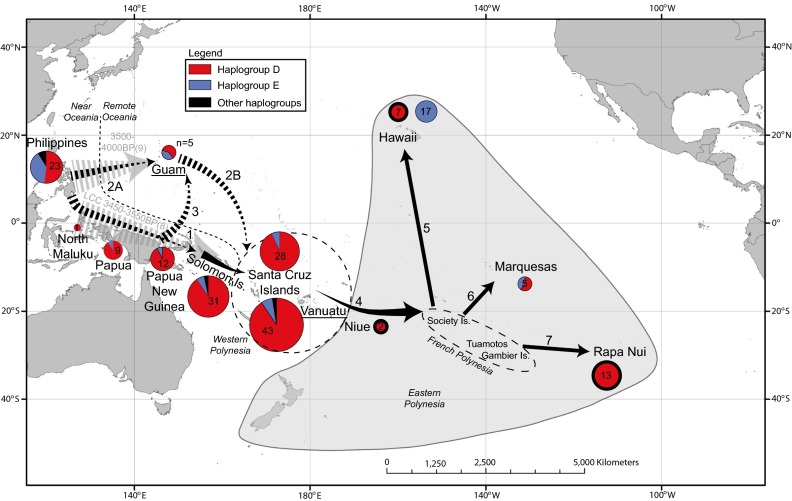
Fig. 1.
Map showing samples and localities mentioned in this study. Samples from Vanuatu and Guam previously published in Dancause et al. (26) are underlined, with haplogroup frequencies of the chicken specimens indicated by pie charts (thick outlines indicate ancient samples). Colors refer to haplotype/haplogroup: D haplogroup in red, E haplogroup in blue, and all other haplotypes are in black. Gray arrows represent movements inferred from archaeological data (49), whereas black arrows represent routes tested in BayeSSC analysis (dashed arrows indicate movements tested in different scenarios, whereas solid arrows are constant across the different scenarios). 1, introduction of chickens within Near Oceania; 2, alternate hypothesis proposed by (38); 3, introduction of chickens from New Guinea into Micronesia; 4–7, spread of chickens from Western Polynesia into, and within, Eastern Polynesia. Dashed line indicates demarcation between Near and Remote Oceania, Western Polynesia is defined by a dashed circle, and Eastern Polynesia is indicated by a gray shaded triangle.

