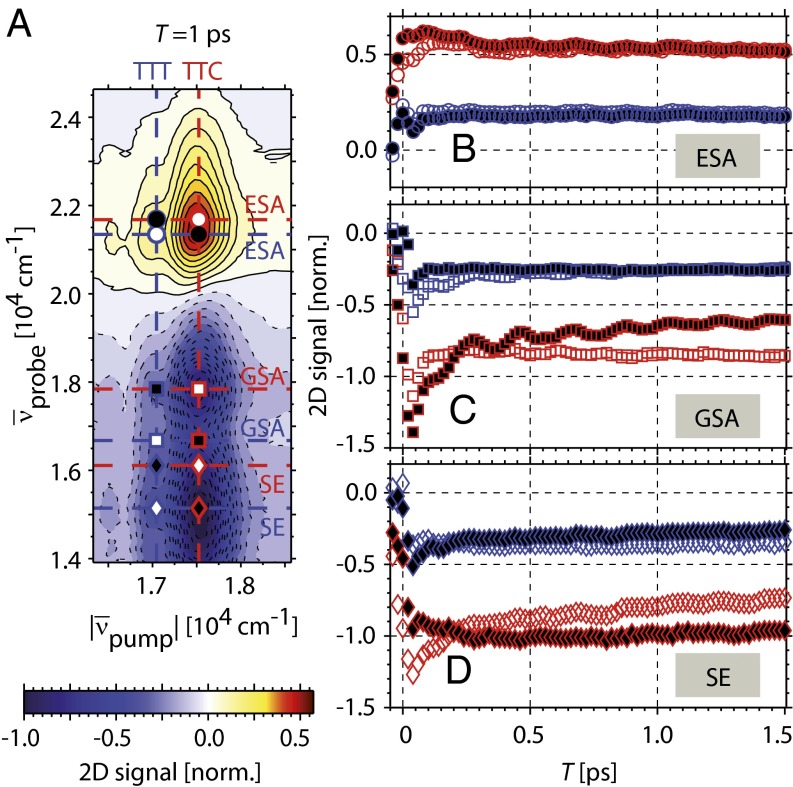
Fig. 4.
Evolution of the 2D signal up to 1.5 ps after photoexcitation. (A) Exemplary 2D spectrum for  . The temporal evolution as a function of population time is shown for (B) ESA (circles), (C) GSA (squares), and (D) SE signals (diamonds). Corresponding
  coordinates are indicated in A by their associated markers. Red markers represent contributions after TTC excitation, blue ones those after mostly TTT excitation. White filling corresponds to excitation and probing of the same isomer, black filling to different isomers, respectively.

