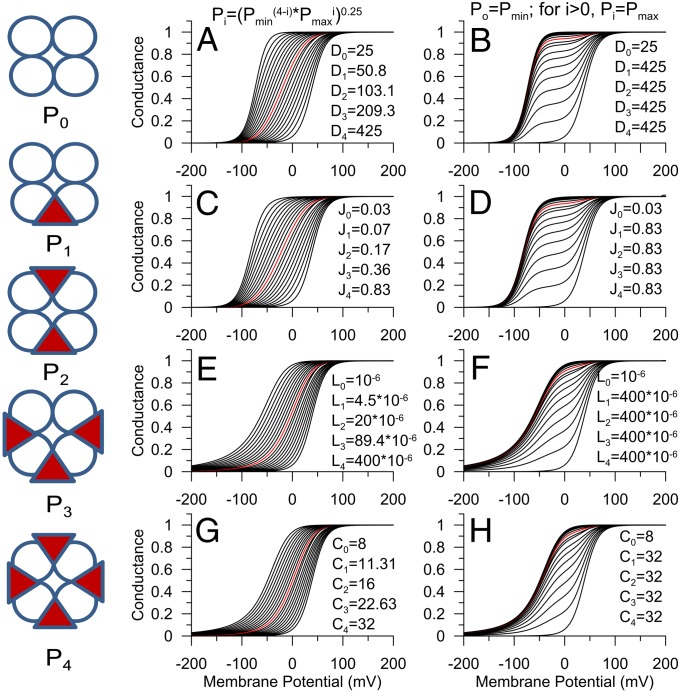
Fig. 2.
Both incremental and all-or-none gating shifts can be explained within the context of the HA model. (Left) Diagrams reflect five potential γ1:α-subunit stoichiometries: triangles, γ1-subunits; circles, α-subunits. Pi reflects the value of a given allosteric parameter for that particular stoichiometry (P0–4), with the value defined from equations on the top. (A, C, E, and G) Incremental changes in a given overall allosteric constant; (B, D, F, and H) all-or-none effects. For all panels, each curve corresponds to a different mole fraction of modified subunits (pi = 0–1, stepsize 0.05). Red curve corresponds to pi = 0.5. For a given pi, conductance was calculated based on an HA model for a population of channels with stoichiometries defined by expected binomial distribution expected for a given pi. Default HA parameters were L = 10−6, D = 25, J = 0.03, C = 8, K = 11, E = 2.4, with zL = 0.3e and zJ = 0.58e, with [Ca2+] = 10 μM. (A) Values of D for different stoichiometries were calculated from the indicated equation with Dmin = 25 and Dmax = 425. (B) A single active subunit was sufficient to make D for any subunit combination 425. (C) J was varied incrementally for each stoichiometric combination. (D) J was varied in an all-or-none fashion. (E) L was varied in an incremental fashion. (F) L was varied in an all-or-none fashion. (G) C was varied incrementally. (H) C was varied in an all-or-none fashion.

