Fig. 4.
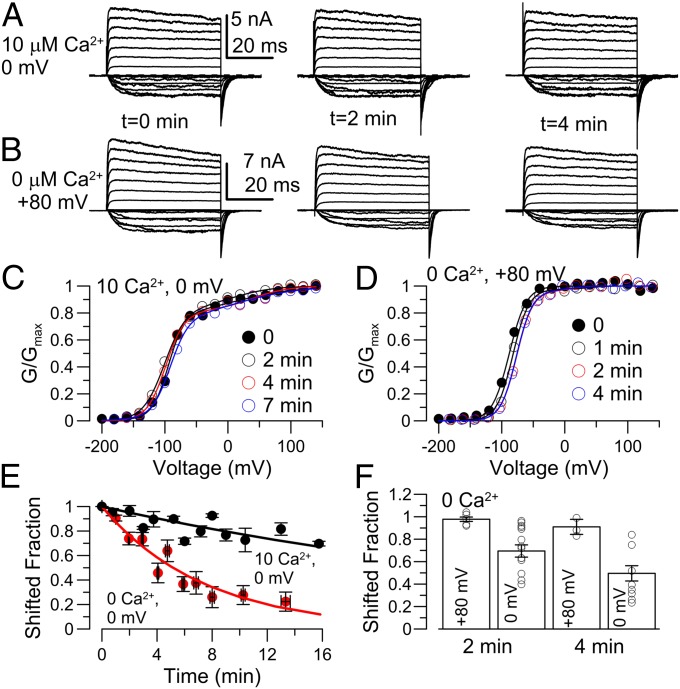
Loss of γ1-induced gating shift is hindered in a state-dependent fashion. (A) After patch excision, the patch was held at 10 μM Ca2+, 0 mV for the indicated cumulative time between each family of traces (left to right). (B) Patch was held at 0 Ca2+, +80 mV between families of traces (GVs at 10 μM Ca2+). (C) GV curves from traces in A. (D) GV curves from traces in B. (E) The fraction of the most negatively shifted GV component in a two-Boltzmann fit is plotted vs. elapsed time at 0 Ca2+, 0 mV (Fig. 3) and for 10 μM Ca2+, 0 mV (as in A). Values from individual patches were averaged over segments of time. Single exponential time constant of loss of shift was 7.4 min in 0 Ca2+ and, for 10 μM Ca2+, 39.5 min. (F) Means and individual values of loss of shift are plotted for 2 and 4 min after patch excision, revealing some variability among patches in rundown at 0 mV, 0 Ca2+.

