Figure 5.

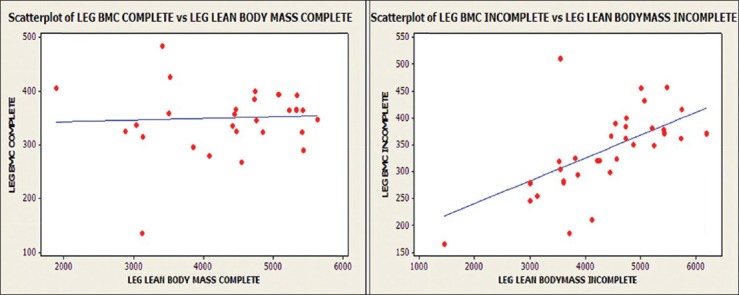
Relationship of leg BMC with leg lean tissue mass for those with complete or incomplete SCI (complete: R = 0.055, P > 0.05; incomplete: R = 0.565, P < 0.001)

Relationship of leg BMC with leg lean tissue mass for those with complete or incomplete SCI (complete: R = 0.055, P > 0.05; incomplete: R = 0.565, P < 0.001)