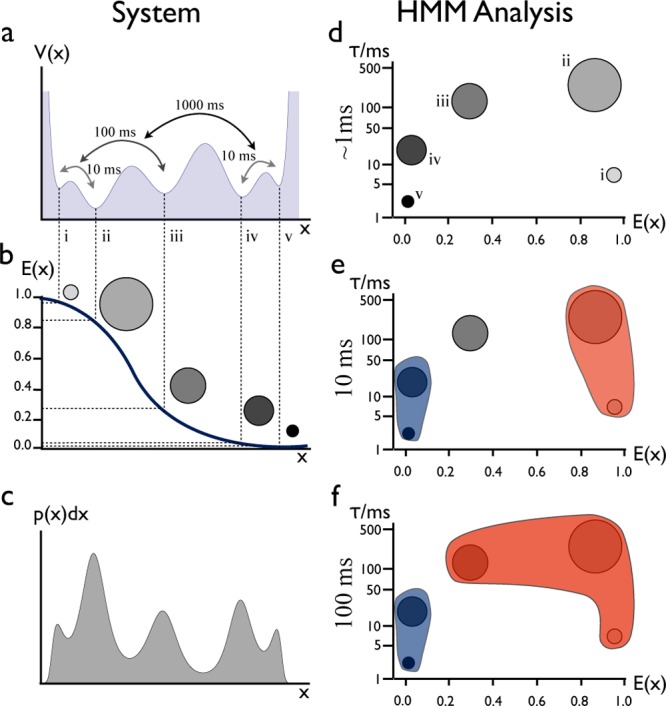
Figure 2.

Conceptual illustration of a HMM-based FRET analysis. (a) Hierarchical free energy landscape with various minima (conformations) interconverting on different time scales. (b) A FRET efficiency versus distance curve, with the five conformations in panel a assigned to certain FRET efficiencies (distances). Conformations with suitably long lifetimes can be distinguished by HMM analysis of FRET traces but may have overlapping FRET efficiencies even when they are distinct. (c) Probability density function of finding the system at a certain value of the distance parameter. (d) The states found in the HMM analysis are depicted as disks located in a two-dimensional space of efficiency (abcissa) and lifetime (ordinate). (e, f) Some states kinetically merge on longer observation time scales indicated by the blue and red areas in panels e (τ = 10 ms) and f (τ = 100 ms). For example, state pairs (i, ii) and (iv, v) each merge into a single apparent state for times longer than 10 ms.
