
Figure 4.
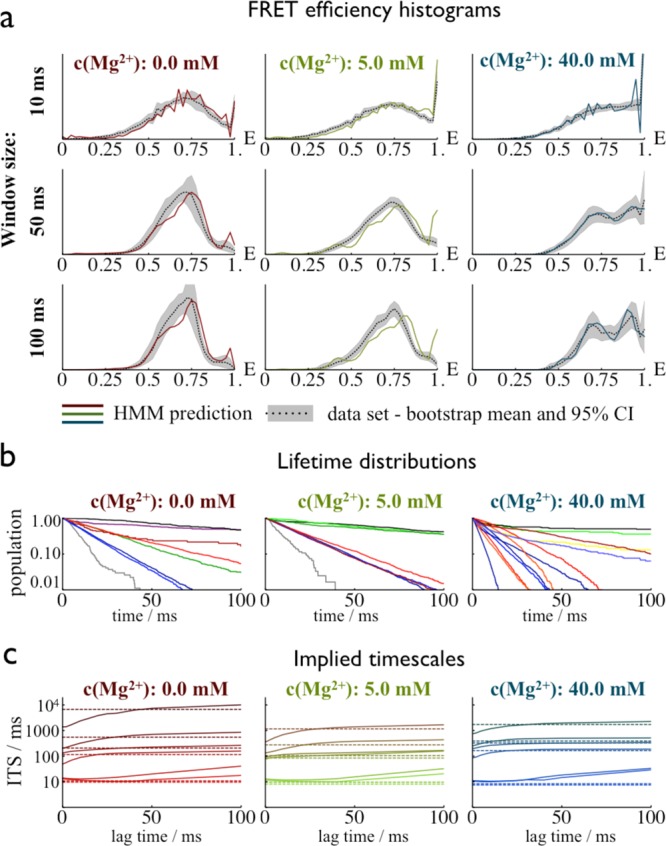
Validation of the hidden Markov models. (a) Dependence of the FRET efficiency histograms on the lengths of the time windows (10, 50, and 100 ms). Dashed colored lines, prediction from the hidden Markov model; gray areas/dotted black lines, estimation from the smFRET data set (bootstrapping mean/95% confidence interval). (b) Lifetime distributions of the individual states calculated from the maximum-likelihood paths. Line coloring corresponds to the coloring of the states in Figure 5. (c) Implied time scales, indicating that the long-time kinetics of the hidden paths is Markovian and converges to time scales similar to those found in the HMM. The divergence of the shortest time scales at larger lag times is expected and due to numerical problems.48