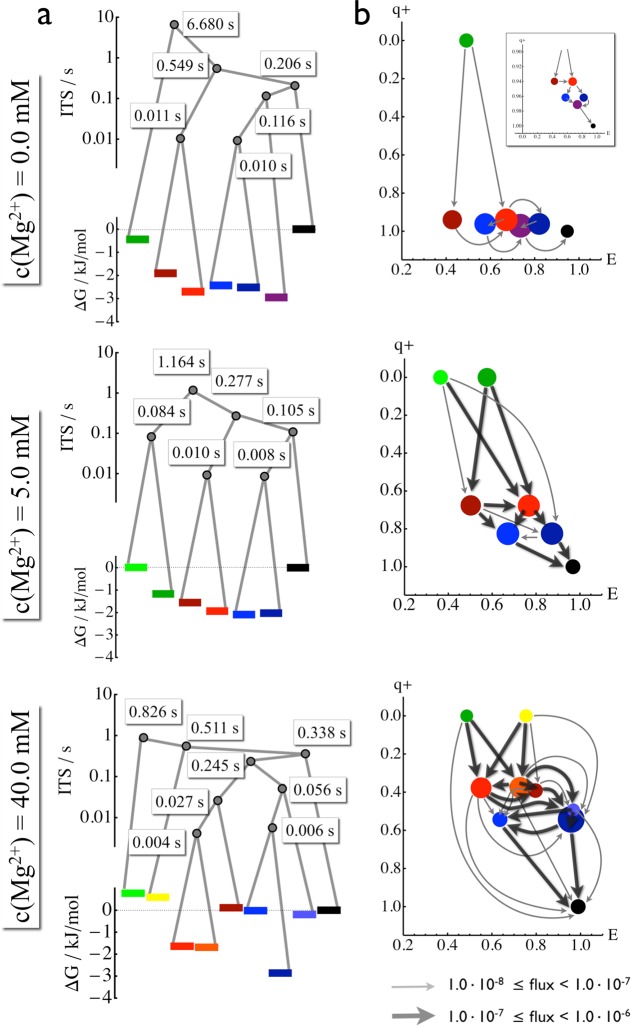
Figure 6.
Free energy landscape and folding pathways. States are indicated by bars or discs with the same colors used in Figure 5. (a) Free energy landscape and hierarchy of the kinetic processes. Bars indicate the free energy of states. Gray bullets indicate transition states facilitating that states or sets of states kinetically merge at longer time scales. The corresponding time scales are given in seconds. (b) The complete ensemble of folding pathways from the least compact states (green/yellow) to the most compact state (black). The states are positioned depending on their mean FRET efficiency (abcissa) and the probability of folding (committor, q+, ordinate). The thickness of an arrow is proportional to the probability that a green/yellow state will fold along this pathway.

