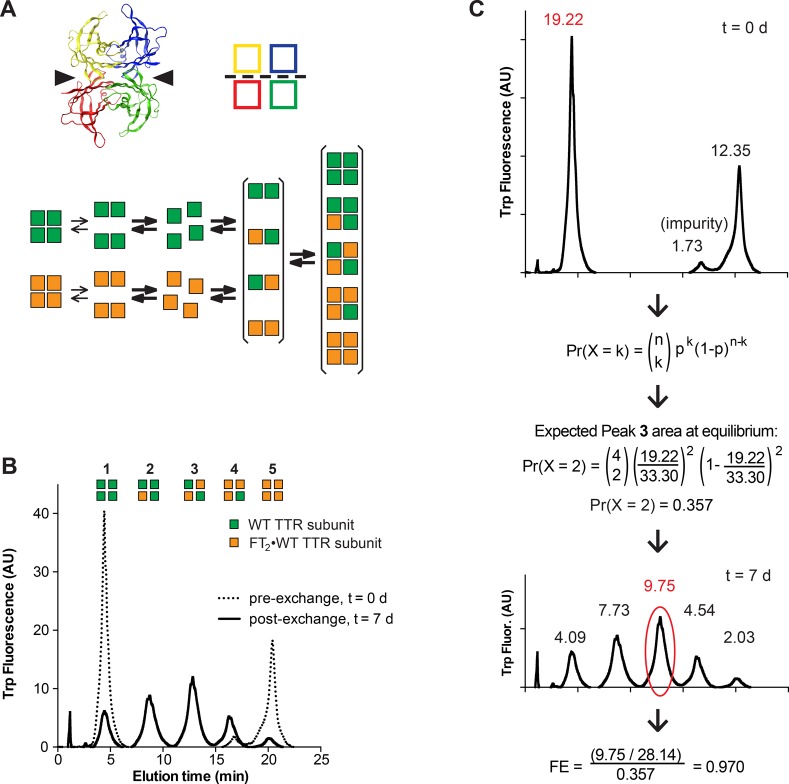
Figure 1.
Subunit exchange measures the stability of recombinant TTR tetramers. (A) The top left panel shows a ribbon diagram of the TTR tetramer with individual subunits shown in different colors. Arrowheads indicate the thyroxine-binding pockets. The top right panel shows a cartoon of the same tetramer. The weak dimer–dimer interface is indicated with a dotted line. The bottom panel shows a schematic of the steps involved in dissociation, reassociation, and subunit exchange of untagged WT TTR subunits (green squares) and dual-FLAG-tagged (FT2) WT TTR subunits (orange squares). (B) Recombinant WT and FT2·WT TTR were mixed in equal amounts and separated by ion exchange chromatography after exchange for 7 days. The initial populations of homotetramers mix to create heterotetramers incorporating zero to four FT2·WT TTR subunits. Green squares represent untagged WT TTR subunits and orange squares FT2·WT TTR subunits. (C) To quantify subunit exchange, the relative area of peak 1 at time zero is calculated and used in the binomial equation to calculate the expected area of peak 3 at equilibrium. At each time point, the fraction exchange is calculated by comparing the actual relative area of peak 3 at that time point to the expected relative area of peak 3 at equilibrium (see the text for details).

