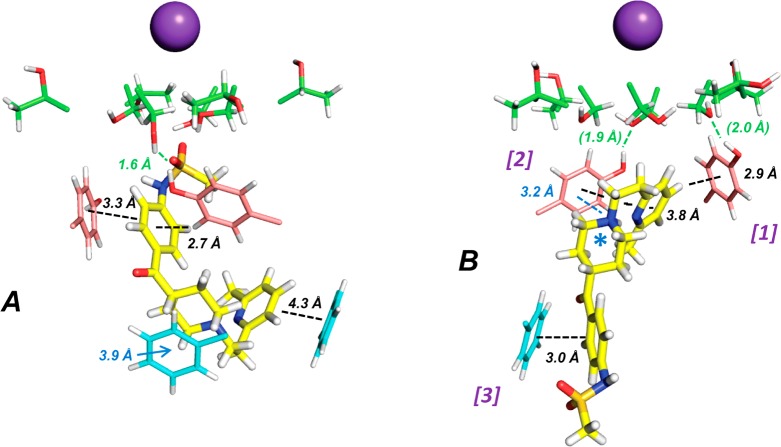
Figure 7.
Representative low-energy score poses for E-4031 docked into the MthK (1LNQ) hERG pore model using GOLD (CHMPLP scoring) (panel A) and Flexidock (panel B), respectively. E-4031 is represented by yellow bonds. Y652 (mauve), F656 (blue), and T623/S624 (green) side chains are represented as thin sticks. Y652 and F656 side chains that do not make specific drug interactions according to the criteria of Table 2 are omitted. Annotations depict the following interaction types: π–π stacking (black); cation-π (blue); hydrogen bond (green); cation near K+ binding site (blue star). Hydrogen bond annotations in brackets represent intraprotein interactions between Y652 phenolic OH and S624 side chain hydroxyls. The pore subunits of specific Y652 or F656 side chains are numbered in purple in panel B (see text).

