
Figure 3.
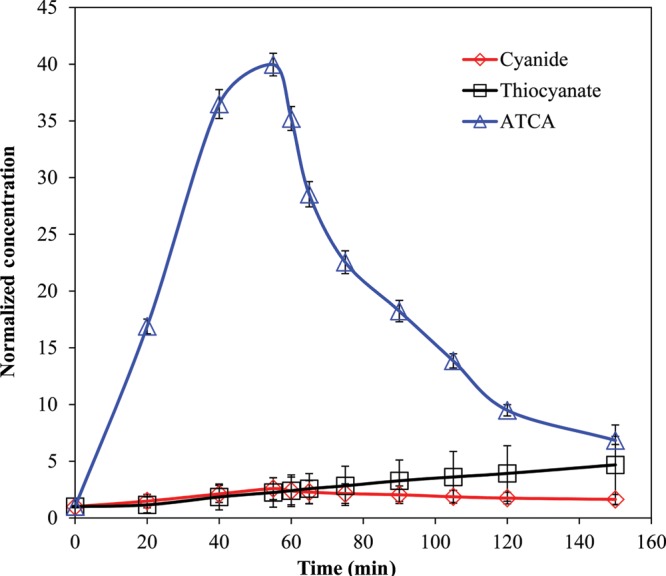
Plasma CN, SCN− and ATCA normalized concentrations after 10 mg NaCN infusion to rabbits. Error bars are plotted as standard error of mean (SEM) (N = 8).
Official websites use .gov
A
.gov website belongs to an official
government organization in the United States.
Secure .gov websites use HTTPS
A lock (
) or https:// means you've safely
connected to the .gov website. Share sensitive
information only on official, secure websites.
Plasma CN, SCN− and ATCA normalized concentrations after 10 mg NaCN infusion to rabbits. Error bars are plotted as standard error of mean (SEM) (N = 8).