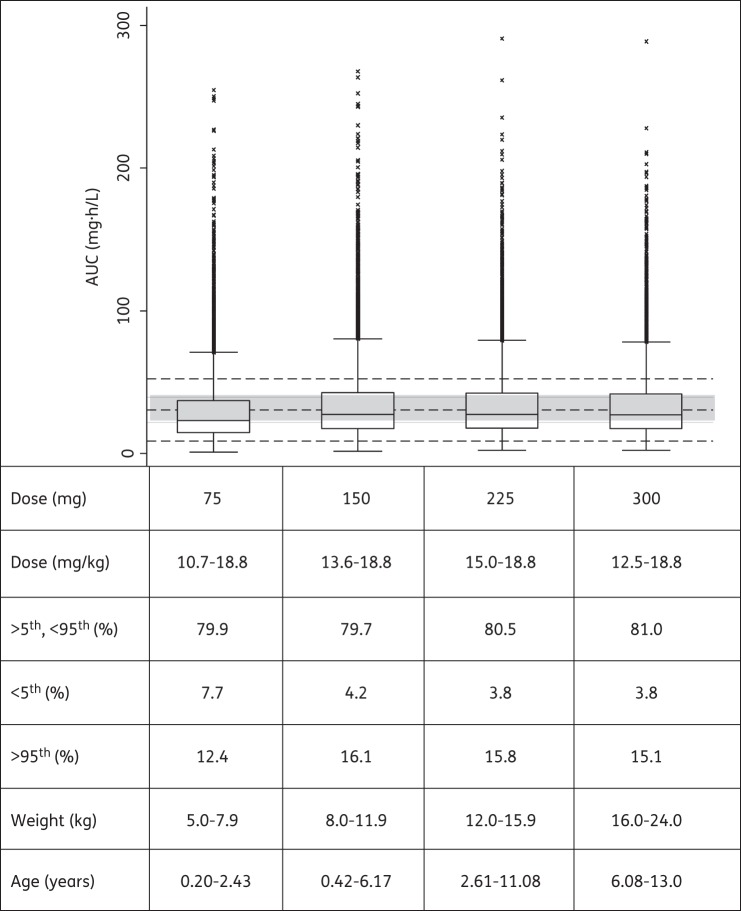
Figure 3.
Box plot of simulated steady-state AUC of rifampicin across different age and weight bands, obtained adhering as closely as possible to the revised guidelines in dose per unit weight according to WHO 2010 dosing guidelines. Each box shows the 25th–75th percentile of simulated AUC and the symbol ‘x’ shows data falling outside 1.5 times the IQR (25th–75th). The lower, middle and upper broken lines are the derived 5th percentile (9.0 mg · h/L), median (30.7 mg · h/L) and 95th percentile (52.4 mg · h/L) of the adult AUC, respectively. The grey shaded area is the 25th–75th (21.9–39.5 mg · h/L) percentile of the adult AUC.

