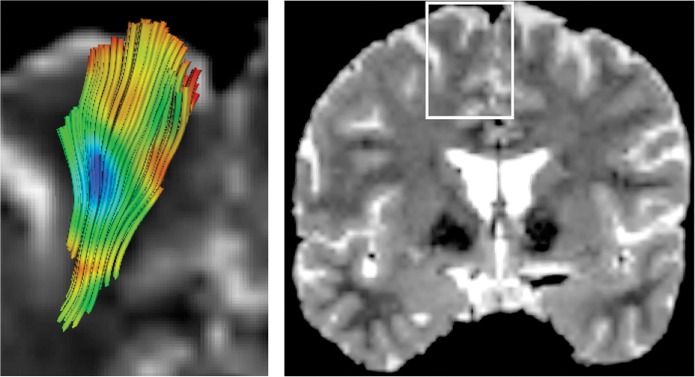
Figure 1.

(left) Visual presentation of the dispersion index (SHD) mapped onto a set of fiber tracts that fan towards the para-sagittal cortex, in a region indicated with a white rectangle on a T2-weighted image (right). The color-coding follows the rainbow colormap: Blue tones indicate high SHD values; green, intermediate values; and red, low values.
