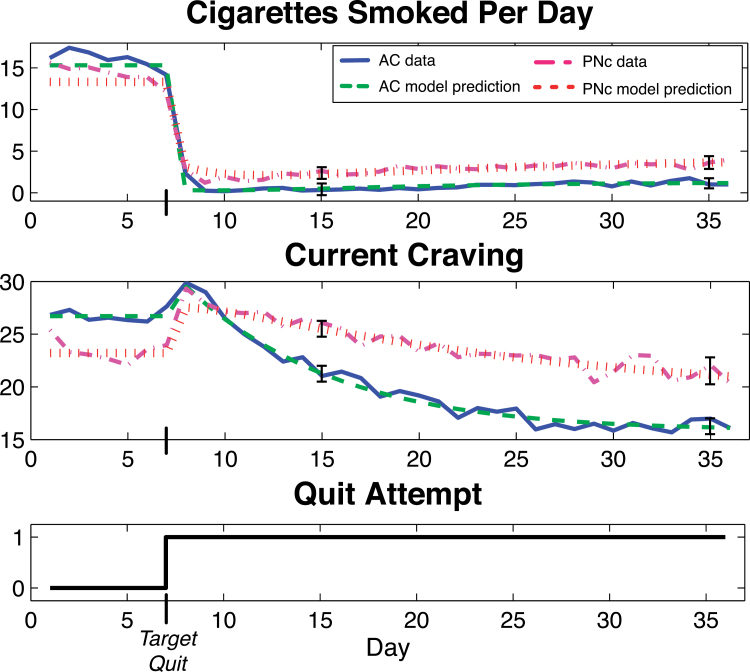
Figure 3.
Data and simulated responses of CPD (top) and Current Craving (middle) to a quit attempt (Quit = 0 prior to the target quit day and Quit = 1 beginning on the target quit day): AC data = solid line; response predictions given by the estimated self-regulation models = dashed line; PNc data = dash-dot line; response predictions = dotted line. The 99% CIs for the model predictions are indicated for Days 15 and 35, where the target quit date is Day 7.

