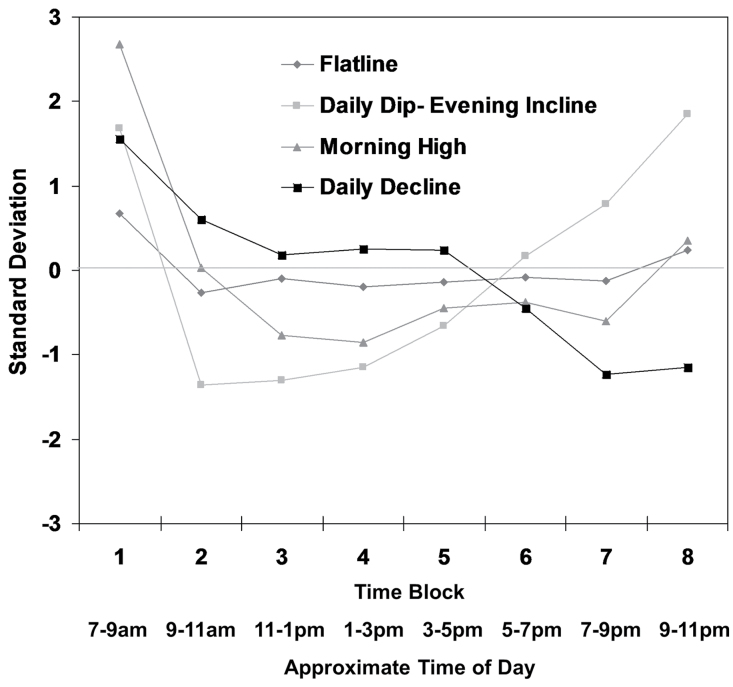
Figure 2.
The figure shows the relative frequency of smoking in each of eight 2-hr blocks defined by time of day, with approximate times reported below the axis. Actual times and span of each block differed by subject and day, according to when they woke up and went to bed. Smoking frequency is indicated on a standard scale, relative to each subject’s average. The lines represent patterns seen in different clusters defined by their circadian patterns of smoking. Figure from Chandra et al. (2007), reprinted with APA permission.

