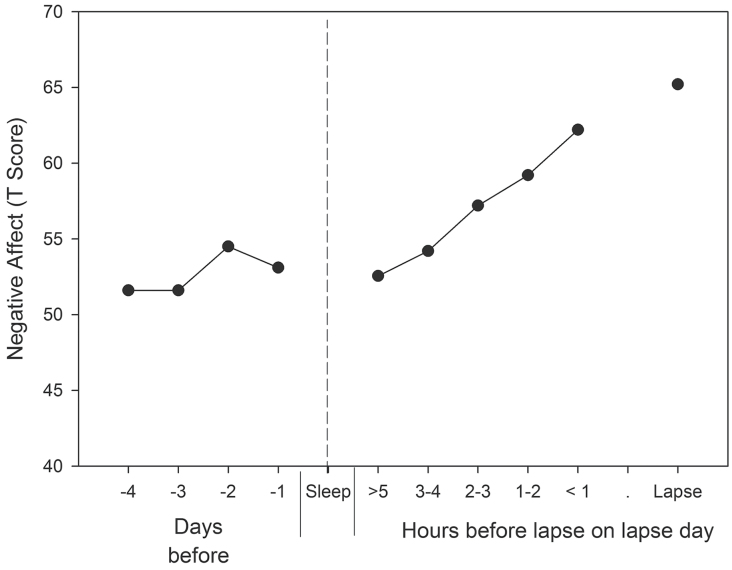
Figure 3.
The figure shows the negative affect reported by subjects who lapsed, by time prior to the first lapse; the final point represents the negative affect reported to have been experienced just before the lapse. The data are limited to subjects who attributed their lapse to negative affect or stress. The left panel shows data aggregated to daily averages, for the 4 days preceding the first lapse. The right panel is based on reports on the day of the lapse itself, but preceding the lapse. The points represent a smoothed moving average of affect reported at individual assessment occasions. Based on Shiffman and Waters (2004), reprinted with APA permission.

