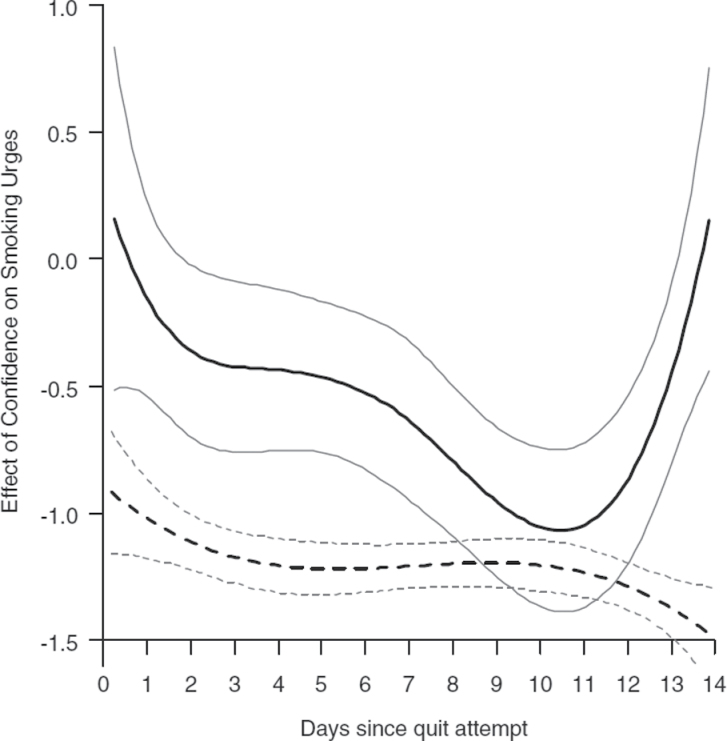
Figure 5.
A graphical summary of slope functions of the time-varying effects of self-efficacy (SE) on smoking urges for relapsers (solid line, N = 40) and successful quitters (dashed line, N = 207) over the course of 2 weeks postquit. Each curve shows the estimated slope for smoking urges versus SE (confidence); negative values indicated that higher SE is associated with lower urges. The grey lines (solid and dashed) surrounding each line represent the 95% CI for each curve. Figure from Shiyko et al. (2012), reprinted with permission of Springer Science and Business Media.

