
Figure 2.
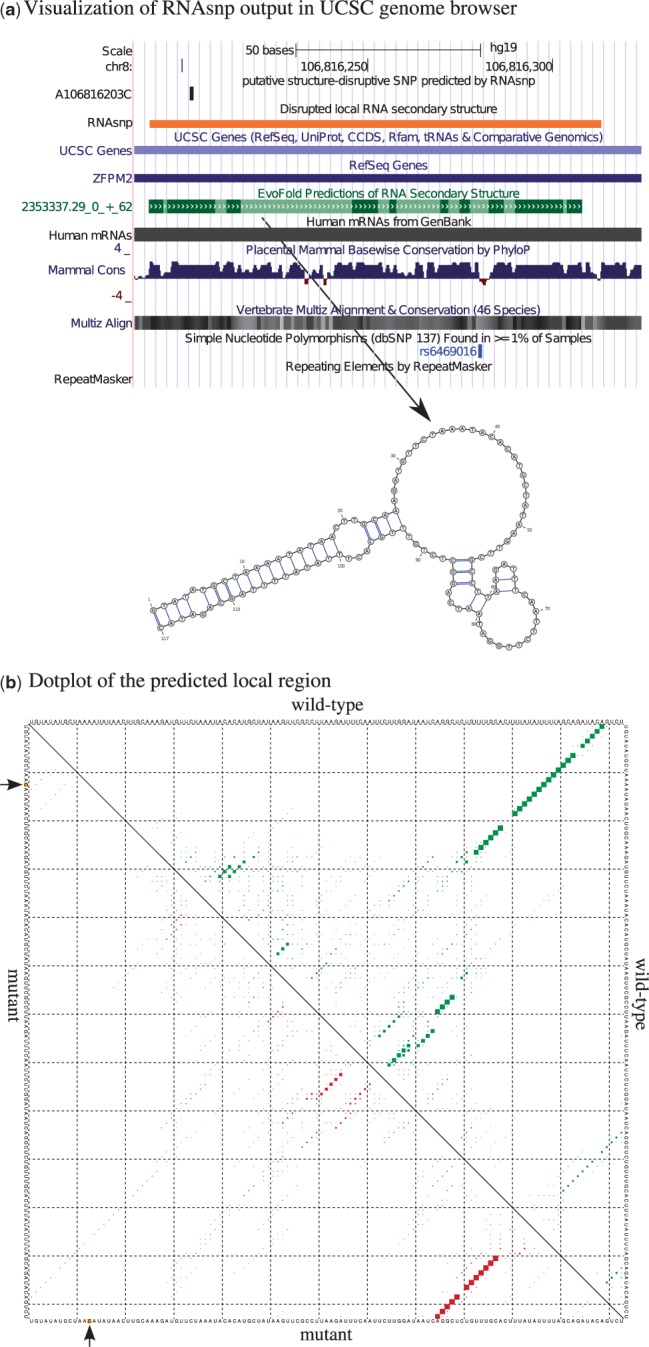
The RNAsnp web server output for a putative structurally disruptive SNP, A106816203C, screened from chromosome 8 of human hg19 assembly. (a) The output of A106816203C displayed at the UCSC genome browser. The local region predicted by RNAsnp overlaps with the conserved RNA secondary structure predicted by EvoFold. (b) Dot plot shows the base pair probabilities of the local RNA secondary structure, where the upper triangle represents the probabilities for wild-type (green) and the lower triangle represents the mutant (red). The arrow mark indicates the SNP position.