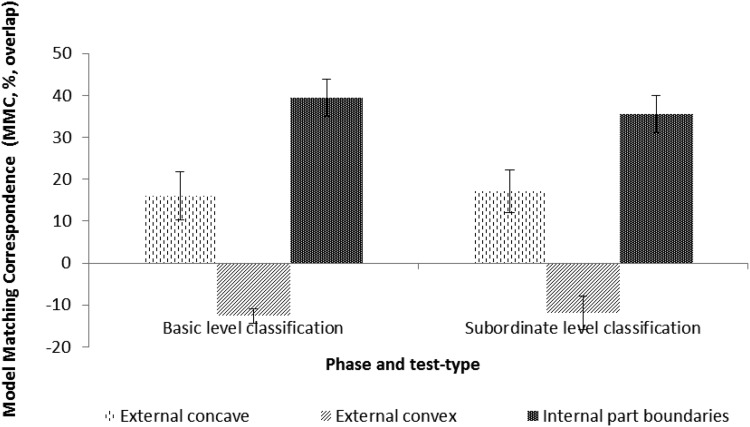
Figure 4.
Data-model correspondences across tasks. These are expressed (see the Methods section) in terms of model matching correspondence (MMC). MMC values are expressed relative to the percentage of overlap accounted for by variation in low-level image statistics or visual saliency (see Leek et al., 2012) by generating fixation overlap distributions relative to those predicted by the saliency model. A positive MMC value indicates a higher fixation data-model correspondence than that accounted for by visual saliency. In contrast, a negative value indicates a lower fixation data-model correspondence than that accounted for by visual saliency. Bars show standard error of the mean (% overlap).

