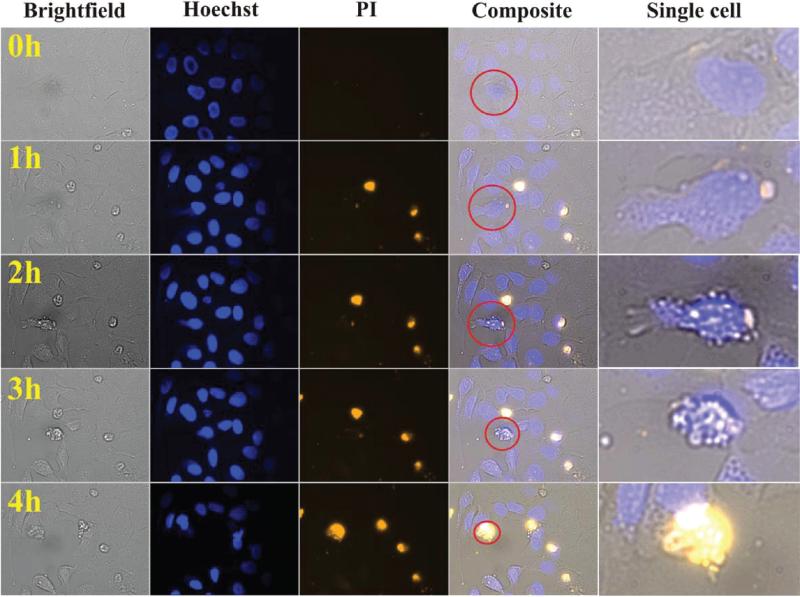
Figure 4.
Time-resolved imaging of apoptosis at a single cell level. Human osteosarcoma U2OS cells were cultured on a chip and exposed to 2 μM staurosporine for up to 4 h in the continuous presence of the plasma membrane permeability marker PI. Red circles denote the magnified cell undergoing apoptosis (right panels). Note the subsequent stages of apoptosis that involve: (i) loss of cell–cell contacts (1 h); (ii) cell dehydration, shrinkage and plasma membrane blebbing (2 h); (iii) rounding up and loss of attachment with substrate (3 h); (iv) an increase in plasma membrane permeability to PI that represents a final destabilization of plasma membrane during apoptosis (4 h).

