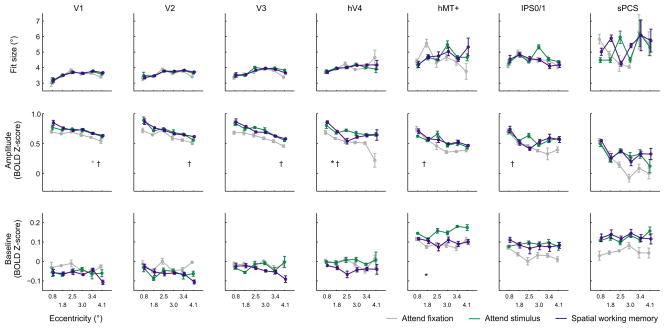
Figure 7. Fit parameters to spatial representations after controlling for task difficulty.
As in Figure 5, a surface was fit to the averaged, coregistered spatial representations for each participant. However, in this case task difficulty was carefully matched between conditions, and representations were based solely on trials in which the participant made a correct behavioral response (Fig. 6b). Results are similar to those reported in Figure 5: attention acts to increase the fit amplitude of spatial representations in hV4, but does not act to decrease size. In hMT+, attention also acted in a non-localized manner to increase the baseline parameter. Statistics as in Figure 5. Error bars reflect within-participant S.E.M.

