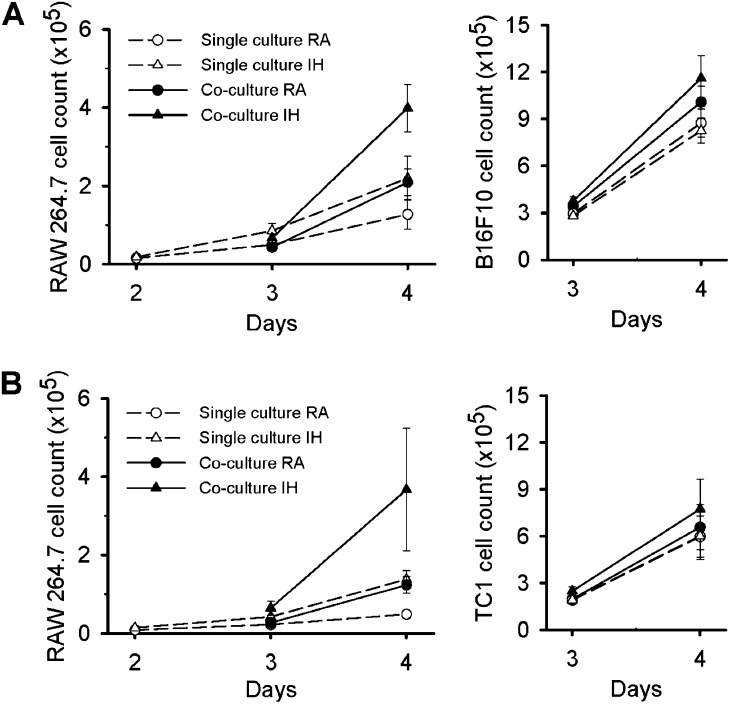
Figure 4.
B16F10 and TC1 tumor cells in single culture and in coculture with RAW 264.7 cells. (A) Cell count of RAW 264.7 cells and B16F10 cells either in single culture (dashed line, open symbols) or in coculture (solid line, filled symbols). RAW 264.7 cells proliferate faster in coculture with B16F10 cells in room air (RA) (circles) compared with in single culture. However, intermittent hypoxia (IH) (triangles) enhanced their proliferation in single culture and in coculture. B16F10 increased their proliferation in coculture with macrophages when compared with single culture conditions, and these features were further enhanced in IH. (B) Cell count of RAW 264.7 cells and TC1 cells either in single culture or in coculture. These results show the same behavior of TC1 cells in response to RAW 264.7 and IH to that obtained from B16F10.

