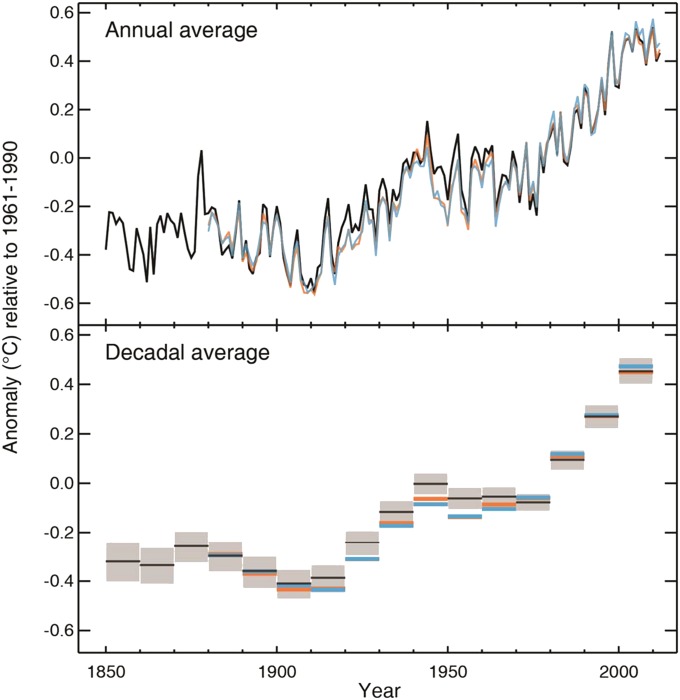
Figure 2.
Observed globally averaged combined land and ocean surface temperature anomaly from 1850 to 2012 from three datasets used by the Intergovernmental Panel on Climate Change. Bottom panel: decadal mean values including the estimate of uncertainty for one dataset (black). Reprinted by permission from Reference 2.

