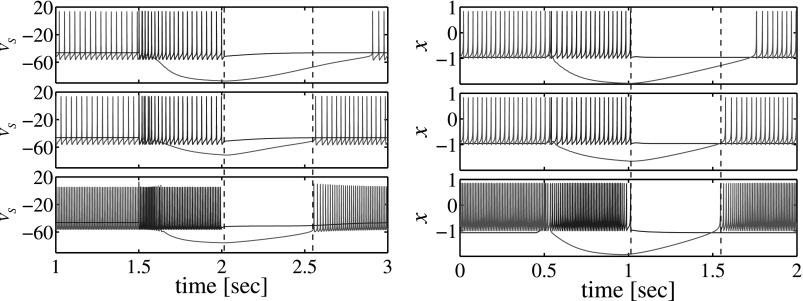
Figure 6.
Waveforms illustrating post-inhibitory recovery time as a function of synaptic strength and excitation level. The left panel shows simulations done with the conductance-based model with Vt = −57.00 mV, ; Vt = −57.00 mV, and Vt = −64.50 mV, up-down, respectively. The right panel shows similar simulations done with the map-based model with σ = 0.2, g = 1.5; σ = 0.2, g = 0.5 and σ = 0.44, g = 0.5 up-down, respectively.

