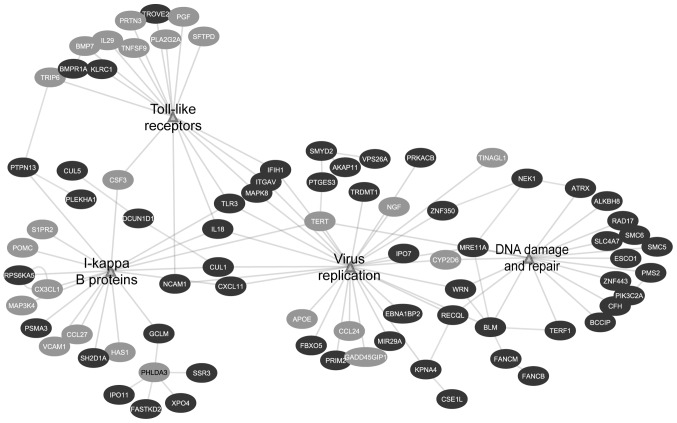
Figure 3.
EGAN analysis showing the viral response network. The viral response network is composed from virus replication, IκB proteins, toll-like receptors and DNA damage and repair pathways. Each circle represents a gene. Dark gray circles are upregulated genes; light gray circles are downregulated genes. The lines represent connections between different genes belonging to different pathways.

