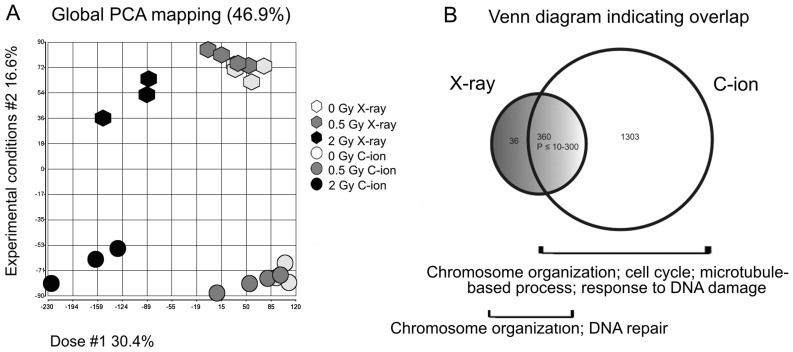
Figure 1.
Radiation-induced changes in global gene expression. (A) 2D Principal component analysis (PCA) for PC3 cells after various doses of carbon ion irradiation or X-rays. PCA is based on global gene expression patterns for each irradiation condition. Analysis revealed distinct clustering in four groups of which the percent variability explained by the components dose and experimental conditions was 30.4 and 16.6%, respectively. (B) Venn diagrams showing overlap of significantly altered genes after 2.0 Gy irradiation of either beam quality. After 2.0 Gy carbon ion irradiation (white circle) and 2.0 Gy X-rays (grey circle) there are respectively 1,663 and 396 genes differentially expressed (DEX). There was a very significant overlap in gene expression changes between the conditions.

