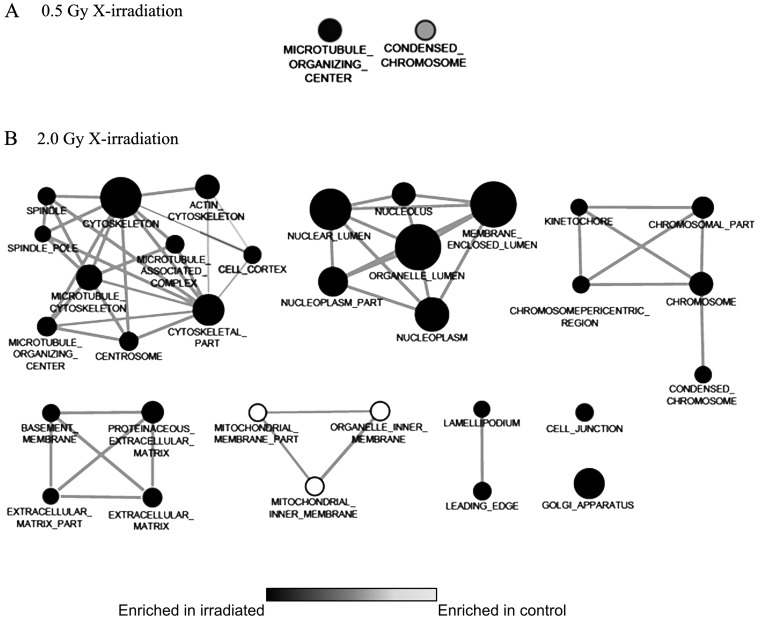
Figure 4.
Enrichment Maps based on gene set enrichment analysis (GSEA) for GO cellular components after X-irradiation (A, 0.5 Gy, and B, 2.0 Gy). White nodes represent gene sets enriched in irradiated samples (i.e. upregulated in irradiated samples), black nodes represent gene sets in control samples (i.e. downregulated in irradiated samples). Node size correlates with the number of genes within each gene set. Edge width represents the overlap of member genes between gene sets. Enriched gene sets included have a P<0.001 and a false discovery rate (FDR) value <0.05.

